Assignment 8 : Xarray Groupby
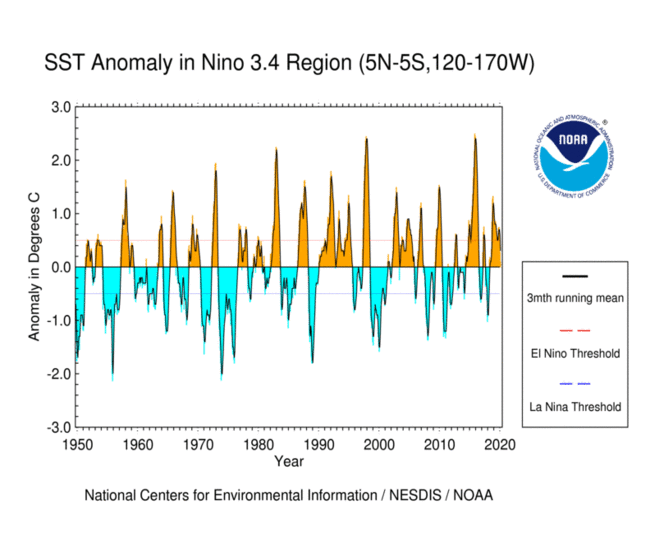
Here will will calculate the NINO 3.4 index of El Nino variabillity and use it to analyze datasets.
First read this page from NOAA. It tells you the following.
- The Nino 3.4 region is defined as the region between +/- 5 deg. lat, 170 W - 120 W lon.
- Warm or cold phases of the Oceanic Nino Index are defined by a five consecutive 3-month running mean of sea surface temperature (SST) anomalies in the Niño 3.4 region that is above (below) the threshold of +0.5°C (-0.5°C). This is known as the Oceanic Niño Index (ONI).
(Note that "anomaly" means that the seasonal cycle is removed.)
1. Reproduce the SST curve from the figure below
Use the NOAA_NCDC_ERSST_v3b_SST.nc file we worked with in class. (You should already have downloaded it; the link is http://ldeo.columbia.edu/~rpa/NOAA_NCDC_ERSST_v3b_SST.nc.)
You don't have to match the stylistic details, just the "3mth running mean" curve.

In [ ]:
2. Calculate boolean timeseries representing the positive / negative enso phases
Plot them somehow.
In [ ]:
3. Plot composites of SST anomaly for the positive and negative ENSO regimes
In [ ]:
Now load the following dataset of precipitation.
I have given you the code to fix the broken date variable.
In [ ]:
import pandas as pd
import xarray as xr
url = 'http://iridl.ldeo.columbia.edu/SOURCES/.NASA/.GPCP/.V2p1/.multi-satellite/.prcp/dods'
dsp = xr.open_dataset(url, decode_times=False)
true_time = (pd.date_range(start='1960-01-01', periods=len(dsp['T']), freq='MS')
             +pd.Timedelta(days=14))
dsp['T'] = true_time
dsp = dsp.rename({'T': 'time'})
dsp.load()
4. Calculate the composite of preciptiation for positive and negative ENSO phases.
Plot the difference between these two fields.
In [ ]: