Numpy and Matplotlib

These are two of the most fundamental parts of the scientific python "ecosystem". Most everything else is built on top of them.

In [1]:
import numpy as np

What did we just do? We imported a package. This brings new variables (mostly functions) into our interpreter. We access them as follows.

In [2]:
# find out what is in our namespace
dir()
Out[2]:
['In',
 'Out',
 '_',
 '__',
 '___',
 '__builtin__',
 '__builtins__',
 '__doc__',
 '__loader__',
 '__name__',
 '__package__',
 '__spec__',
 '_dh',
 '_i',
 '_i1',
 '_i2',
 '_ih',
 '_ii',
 '_iii',
 '_oh',
 'exit',
 'get_ipython',
 'np',
 'quit']
In [3]:
# find out what's in numpy
dir(np)
Out[3]:
['ALLOW_THREADS',
 'AxisError',
 'BUFSIZE',
 'CLIP',
 'ComplexWarning',
 'DataSource',
 'ERR_CALL',
 'ERR_DEFAULT',
 'ERR_IGNORE',
 'ERR_LOG',
 'ERR_PRINT',
 'ERR_RAISE',
 'ERR_WARN',
 'FLOATING_POINT_SUPPORT',
 'FPE_DIVIDEBYZERO',
 'FPE_INVALID',
 'FPE_OVERFLOW',
 'FPE_UNDERFLOW',
 'False_',
 'Inf',
 'Infinity',
 'MAXDIMS',
 'MAY_SHARE_BOUNDS',
 'MAY_SHARE_EXACT',
 'MachAr',
 'ModuleDeprecationWarning',
 'NAN',
 'NINF',
 'NZERO',
 'NaN',
 'PINF',
 'PZERO',
 'PackageLoader',
 'RAISE',
 'RankWarning',
 'SHIFT_DIVIDEBYZERO',
 'SHIFT_INVALID',
 'SHIFT_OVERFLOW',
 'SHIFT_UNDERFLOW',
 'ScalarType',
 'Tester',
 'TooHardError',
 'True_',
 'UFUNC_BUFSIZE_DEFAULT',
 'UFUNC_PYVALS_NAME',
 'VisibleDeprecationWarning',
 'WRAP',
 '_NoValue',
 '__NUMPY_SETUP__',
 '__all__',
 '__builtins__',
 '__cached__',
 '__config__',
 '__doc__',
 '__file__',
 '__git_revision__',
 '__loader__',
 '__mkl_version__',
 '__name__',
 '__package__',
 '__path__',
 '__spec__',
 '__version__',
 '_distributor_init',
 '_globals',
 '_import_tools',
 '_mat',
 'abs',
 'absolute',
 'absolute_import',
 'add',
 'add_docstring',
 'add_newdoc',
 'add_newdoc_ufunc',
 'add_newdocs',
 'alen',
 'all',
 'allclose',
 'alltrue',
 'amax',
 'amin',
 'angle',
 'any',
 'append',
 'apply_along_axis',
 'apply_over_axes',
 'arange',
 'arccos',
 'arccosh',
 'arcsin',
 'arcsinh',
 'arctan',
 'arctan2',
 'arctanh',
 'argmax',
 'argmin',
 'argpartition',
 'argsort',
 'argwhere',
 'around',
 'array',
 'array2string',
 'array_equal',
 'array_equiv',
 'array_repr',
 'array_split',
 'array_str',
 'asanyarray',
 'asarray',
 'asarray_chkfinite',
 'ascontiguousarray',
 'asfarray',
 'asfortranarray',
 'asmatrix',
 'asscalar',
 'atleast_1d',
 'atleast_2d',
 'atleast_3d',
 'average',
 'bartlett',
 'base_repr',
 'bench',
 'binary_repr',
 'bincount',
 'bitwise_and',
 'bitwise_not',
 'bitwise_or',
 'bitwise_xor',
 'blackman',
 'block',
 'bmat',
 'bool',
 'bool8',
 'bool_',
 'broadcast',
 'broadcast_arrays',
 'broadcast_to',
 'busday_count',
 'busday_offset',
 'busdaycalendar',
 'byte',
 'byte_bounds',
 'bytes0',
 'bytes_',
 'c_',
 'can_cast',
 'cast',
 'cbrt',
 'cdouble',
 'ceil',
 'cfloat',
 'char',
 'character',
 'chararray',
 'choose',
 'clip',
 'clongdouble',
 'clongfloat',
 'column_stack',
 'common_type',
 'compare_chararrays',
 'compat',
 'complex',
 'complex128',
 'complex256',
 'complex64',
 'complex_',
 'complexfloating',
 'compress',
 'concatenate',
 'conj',
 'conjugate',
 'convolve',
 'copy',
 'copysign',
 'copyto',
 'core',
 'corrcoef',
 'correlate',
 'cos',
 'cosh',
 'count_nonzero',
 'cov',
 'cross',
 'csingle',
 'ctypeslib',
 'cumprod',
 'cumproduct',
 'cumsum',
 'datetime64',
 'datetime_as_string',
 'datetime_data',
 'deg2rad',
 'degrees',
 'delete',
 'deprecate',
 'deprecate_with_doc',
 'diag',
 'diag_indices',
 'diag_indices_from',
 'diagflat',
 'diagonal',
 'diff',
 'digitize',
 'disp',
 'divide',
 'division',
 'divmod',
 'dot',
 'double',
 'dsplit',
 'dstack',
 'dtype',
 'e',
 'ediff1d',
 'einsum',
 'einsum_path',
 'emath',
 'empty',
 'empty_like',
 'equal',
 'errstate',
 'euler_gamma',
 'exp',
 'exp2',
 'expand_dims',
 'expm1',
 'extract',
 'eye',
 'fabs',
 'fastCopyAndTranspose',
 'fft',
 'fill_diagonal',
 'find_common_type',
 'finfo',
 'fix',
 'flatiter',
 'flatnonzero',
 'flexible',
 'flip',
 'fliplr',
 'flipud',
 'float',
 'float128',
 'float16',
 'float32',
 'float64',
 'float_',
 'float_power',
 'floating',
 'floor',
 'floor_divide',
 'fmax',
 'fmin',
 'fmod',
 'format_parser',
 'frexp',
 'frombuffer',
 'fromfile',
 'fromfunction',
 'fromiter',
 'frompyfunc',
 'fromregex',
 'fromstring',
 'full',
 'full_like',
 'fv',
 'generic',
 'genfromtxt',
 'geomspace',
 'get_array_wrap',
 'get_include',
 'get_printoptions',
 'getbufsize',
 'geterr',
 'geterrcall',
 'geterrobj',
 'gradient',
 'greater',
 'greater_equal',
 'half',
 'hamming',
 'hanning',
 'heaviside',
 'histogram',
 'histogram2d',
 'histogramdd',
 'hsplit',
 'hstack',
 'hypot',
 'i0',
 'identity',
 'iinfo',
 'imag',
 'in1d',
 'index_exp',
 'indices',
 'inexact',
 'inf',
 'info',
 'infty',
 'inner',
 'insert',
 'int',
 'int0',
 'int16',
 'int32',
 'int64',
 'int8',
 'int_',
 'int_asbuffer',
 'intc',
 'integer',
 'interp',
 'intersect1d',
 'intp',
 'invert',
 'ipmt',
 'irr',
 'is_busday',
 'isclose',
 'iscomplex',
 'iscomplexobj',
 'isfinite',
 'isfortran',
 'isin',
 'isinf',
 'isnan',
 'isnat',
 'isneginf',
 'isposinf',
 'isreal',
 'isrealobj',
 'isscalar',
 'issctype',
 'issubclass_',
 'issubdtype',
 'issubsctype',
 'iterable',
 'ix_',
 'kaiser',
 'kron',
 'ldexp',
 'left_shift',
 'less',
 'less_equal',
 'lexsort',
 'lib',
 'linalg',
 'linspace',
 'little_endian',
 'load',
 'loads',
 'loadtxt',
 'log',
 'log10',
 'log1p',
 'log2',
 'logaddexp',
 'logaddexp2',
 'logical_and',
 'logical_not',
 'logical_or',
 'logical_xor',
 'logspace',
 'long',
 'longcomplex',
 'longdouble',
 'longfloat',
 'longlong',
 'lookfor',
 'ma',
 'mafromtxt',
 'mask_indices',
 'mat',
 'math',
 'matmul',
 'matrix',
 'matrixlib',
 'max',
 'maximum',
 'maximum_sctype',
 'may_share_memory',
 'mean',
 'median',
 'memmap',
 'meshgrid',
 'mgrid',
 'min',
 'min_scalar_type',
 'minimum',
 'mintypecode',
 'mirr',
 'mod',
 'modf',
 'moveaxis',
 'msort',
 'multiply',
 'nan',
 'nan_to_num',
 'nanargmax',
 'nanargmin',
 'nancumprod',
 'nancumsum',
 'nanmax',
 'nanmean',
 'nanmedian',
 'nanmin',
 'nanpercentile',
 'nanprod',
 'nanstd',
 'nansum',
 'nanvar',
 'nbytes',
 'ndarray',
 'ndenumerate',
 'ndfromtxt',
 'ndim',
 'ndindex',
 'nditer',
 'negative',
 'nested_iters',
 'newaxis',
 'nextafter',
 'nonzero',
 'not_equal',
 'nper',
 'npv',
 'numarray',
 'number',
 'obj2sctype',
 'object',
 'object0',
 'object_',
 'ogrid',
 'oldnumeric',
 'ones',
 'ones_like',
 'outer',
 'packbits',
 'pad',
 'partition',
 'percentile',
 'pi',
 'piecewise',
 'pkgload',
 'place',
 'pmt',
 'poly',
 'poly1d',
 'polyadd',
 'polyder',
 'polydiv',
 'polyfit',
 'polyint',
 'polymul',
 'polynomial',
 'polysub',
 'polyval',
 'positive',
 'power',
 'ppmt',
 'print_function',
 'prod',
 'product',
 'promote_types',
 'ptp',
 'put',
 'putmask',
 'pv',
 'r_',
 'rad2deg',
 'radians',
 'random',
 'rank',
 'rate',
 'ravel',
 'ravel_multi_index',
 'real',
 'real_if_close',
 'rec',
 'recarray',
 'recfromcsv',
 'recfromtxt',
 'reciprocal',
 'record',
 'remainder',
 'repeat',
 'require',
 'reshape',
 'resize',
 'result_type',
 'right_shift',
 'rint',
 'roll',
 'rollaxis',
 'roots',
 'rot90',
 'round',
 'round_',
 'row_stack',
 's_',
 'safe_eval',
 'save',
 'savetxt',
 'savez',
 'savez_compressed',
 'sctype2char',
 'sctypeDict',
 'sctypeNA',
 'sctypes',
 'searchsorted',
 'select',
 'set_numeric_ops',
 'set_printoptions',
 'set_string_function',
 'setbufsize',
 'setdiff1d',
 'seterr',
 'seterrcall',
 'seterrobj',
 'setxor1d',
 'shape',
 'shares_memory',
 'short',
 'show_config',
 'sign',
 'signbit',
 'signedinteger',
 'sin',
 'sinc',
 'single',
 'singlecomplex',
 'sinh',
 'size',
 'sometrue',
 'sort',
 'sort_complex',
 'source',
 'spacing',
 'split',
 'sqrt',
 'square',
 'squeeze',
 'stack',
 'std',
 'str',
 'str0',
 'str_',
 'string_',
 'subtract',
 'sum',
 'swapaxes',
 'take',
 'tan',
 'tanh',
 'tensordot',
 'test',
 'testing',
 'tile',
 'timedelta64',
 'trace',
 'tracemalloc_domain',
 'transpose',
 'trapz',
 'tri',
 'tril',
 'tril_indices',
 'tril_indices_from',
 'trim_zeros',
 'triu',
 'triu_indices',
 'triu_indices_from',
 'true_divide',
 'trunc',
 'typeDict',
 'typeNA',
 'typecodes',
 'typename',
 'ubyte',
 'ufunc',
 'uint',
 'uint0',
 'uint16',
 'uint32',
 'uint64',
 'uint8',
 'uintc',
 'uintp',
 'ulonglong',
 'unicode',
 'unicode_',
 'union1d',
 'unique',
 'unpackbits',
 'unravel_index',
 'unsignedinteger',
 'unwrap',
 'ushort',
 'vander',
 'var',
 'vdot',
 'vectorize',
 'version',
 'void',
 'void0',
 'vsplit',
 'vstack',
 'warnings',
 'where',
 'who',
 'zeros',
 'zeros_like']
In [4]:
# find out what version we have
np.__version__
Out[4]:
'1.13.1'

The numpy documentation is crucial!

http://docs.scipy.org/doc/numpy/reference/
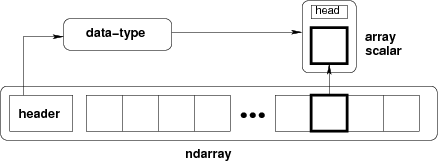
NDArrays

The core class is the numpy ndarray (n-dimensional array).

In [5]:
from IPython.display import Image
Image(url='http://docs.scipy.org/doc/numpy/_images/threefundamental.png')
Out[5]:
In [6]:
# create an array from a list
a = np.array([9,0,2,1,0])
In [7]:
# find out the datatype
a.dtype
Out[7]:
dtype('int64')
In [8]:
# find out the shape
a.shape
Out[8]:
(5,)
In [9]:
# what is the shape
type(a.shape)
Out[9]:
tuple
In [10]:
# another array with a different datatype and shape
b = np.array([[5,3,1,9],[9,2,3,0]], dtype=np.float64)
In [11]:
# check dtype and shape
b.dtype, b.shape
Out[11]:
(dtype('float64'), (2, 4))

Important Concept: The fastest varying dimension is the last dimension! The outer level of the hierarchy is the first dimension. (This is called "c-style" indexing)

More array creation

There are lots of ways to create arrays.

In [12]:
# create some uniform arrays
c = np.zeros((9,9))
d = np.ones((3,6,3), dtype=np.complex128)
e = np.full((3,3), np.pi)
e = np.ones_like(c)
f = np.zeros_like(d)
In [13]:
# create some ranges
np.arange(10)
Out[13]:
array([0, 1, 2, 3, 4, 5, 6, 7, 8, 9])
In [14]:
# arange is left inclusive, right exclusive
np.arange(2,4,0.25)
Out[14]:
array([ 2.  ,  2.25,  2.5 ,  2.75,  3.  ,  3.25,  3.5 ,  3.75])
In [15]:
# linearly spaced
np.linspace(2,4,20)
Out[15]:
array([ 2.        ,  2.10526316,  2.21052632,  2.31578947,  2.42105263,
        2.52631579,  2.63157895,  2.73684211,  2.84210526,  2.94736842,
        3.05263158,  3.15789474,  3.26315789,  3.36842105,  3.47368421,
        3.57894737,  3.68421053,  3.78947368,  3.89473684,  4.        ])
In [16]:
# log spaced
np.logspace(1,2,10)
Out[16]:
array([  10.        ,   12.91549665,   16.68100537,   21.5443469 ,
         27.82559402,   35.93813664,   46.41588834,   59.94842503,
         77.42636827,  100.        ])
In [17]:
# two dimensional grids
x = np.linspace(-2*np.pi, 2*np.pi, 100)
y = np.linspace(-np.pi, np.pi, 50)
xx, yy = np.meshgrid(x, y)
xx.shape, yy.shape
Out[17]:
((50, 100), (50, 100))

Indexing

Basic indexing is similar to lists

In [18]:
# get some individual elements of xx
xx[0,0], xx[-1,-1], xx[3,-5]
Out[18]:
(-6.2831853071795862, 6.2831853071795862, 5.7754531611448723)
In [19]:
# get some whole rows and columns
xx[0].shape, xx[:,-1].shape
Out[19]:
((100,), (50,))
In [20]:
# get some ranges
xx[3:10,30:40].shape
Out[20]:
(7, 10)

There are many advanced ways to index arrays. You can read about them in the manual. Here is one example.

In [21]:
# use a boolean array as an index
idx = xx<0
yy[idx].shape
Out[21]:
(2500,)
In [22]:
# the array got flattened
xx.ravel().shape
Out[22]:
(5000,)

Array Operations

There are a huge number of operations available on arrays. All the familiar arithemtic operators are applied on an element-by-element basis.

Basic Math

In [23]:
f = np.sin(xx) * np.cos(0.5*yy)

At this point you might be getting curious what these arrays "look" like. So we need to introduce some visualization.

In [24]:
from matplotlib import pyplot as plt
%matplotlib inline
In [25]:
plt.pcolormesh(f)
Out[25]:

Manipulating array dimensions

In [26]:
# transpose
plt.pcolormesh(f.T)
Out[26]:
In [27]:
# reshape an array (wrong size)
g = np.reshape(f, (8,9))
---------------------------------------------------------------------------
ValueError                                Traceback (most recent call last)
 in ()
      1 # reshape an array (wrong size)
----> 2 g = np.reshape(f, (8,9))

~/miniconda3/envs/geo_scipy/lib/python3.6/site-packages/numpy/core/fromnumeric.py in reshape(a, newshape, order)
    230            [5, 6]])
    231     """
--> 232     return _wrapfunc(a, 'reshape', newshape, order=order)
    233 
    234 

~/miniconda3/envs/geo_scipy/lib/python3.6/site-packages/numpy/core/fromnumeric.py in _wrapfunc(obj, method, *args, **kwds)
     55 def _wrapfunc(obj, method, *args, **kwds):
     56     try:
---> 57         return getattr(obj, method)(*args, **kwds)
     58 
     59     # An AttributeError occurs if the object does not have

ValueError: cannot reshape array of size 5000 into shape (8,9)
In [28]:
# reshape an array (right size) and mess it up
print(f.size)
g = np.reshape(f, (200,25))
plt.pcolormesh(g)
5000
Out[28]:
In [29]:
# tile an array
plt.pcolormesh(np.tile(f,(6,1)))
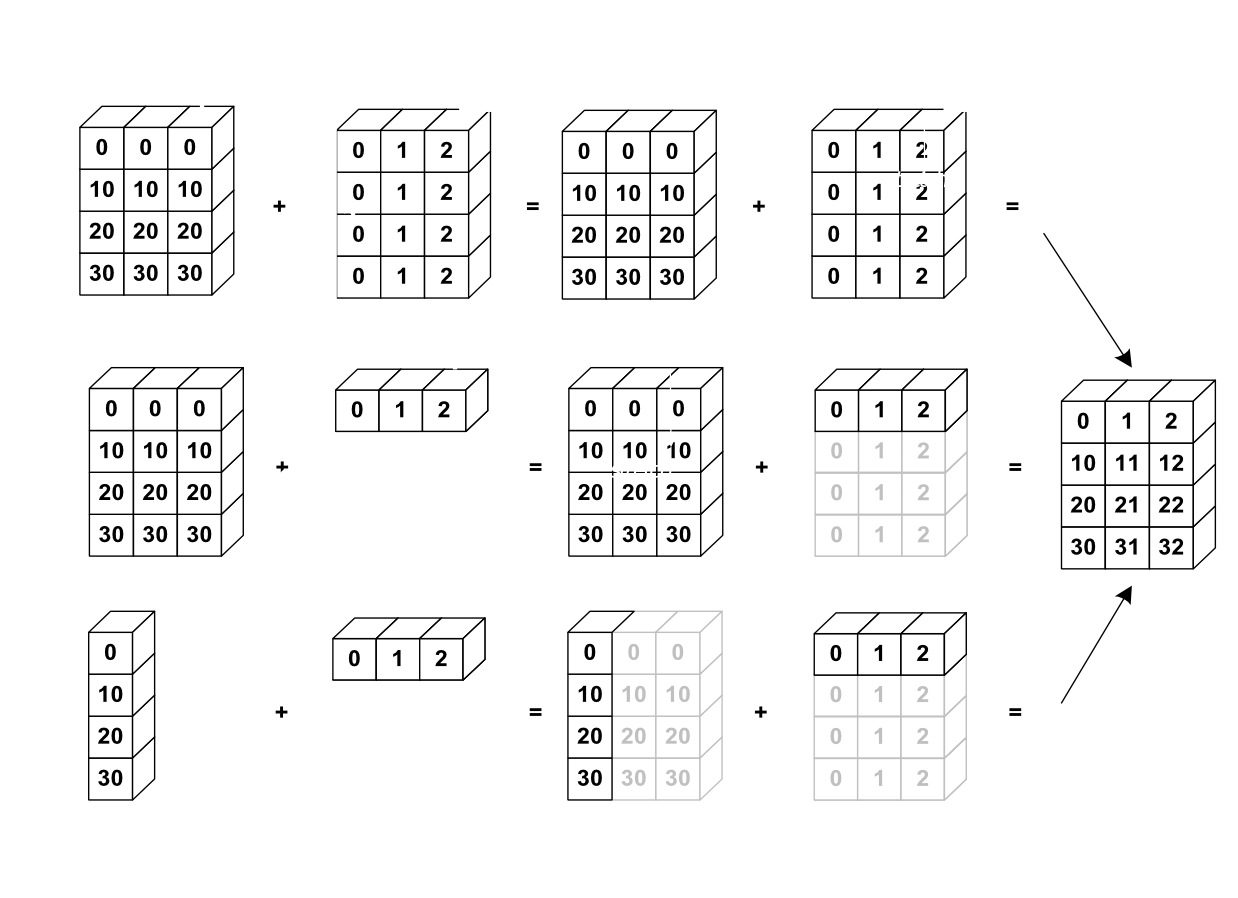
Out[29]:

Broadcasting

Broadcasting is an efficient way to multiply arrays of different sizes

In [30]:
Image(url='http://scipy-lectures.github.io/_images/numpy_broadcasting.png',
     width=720)
Out[30]:
In [31]:
# multiply f by x
print(f.shape, x.shape)
g = f * x
print(g.shape)
(50, 100) (100,)
(50, 100)
In [32]:
# multiply f by y
print(f.shape, y.shape)
h = f * y
print(h.shape)
(50, 100) (50,)
---------------------------------------------------------------------------
ValueError                                Traceback (most recent call last)
 in ()
      1 # multiply f by y
      2 print(f.shape, y.shape)
----> 3 h = f * y
      4 print(h.shape)

ValueError: operands could not be broadcast together with shapes (50,100) (50,) 
In [33]:
# use newaxis special syntax
h = f * y[:,np.newaxis]
print(h.shape)
(50, 100)
In [34]:
plt.pcolormesh(g)
Out[34]:

Reduction Operations

In [35]:
# sum
g.sum()
Out[35]:
-3083.0383878071548
In [36]:
# mean
g.mean()
Out[36]:
-0.61660767756143098
In [37]:
# std
g.std()
Out[37]:
1.6402280119141424
In [38]:
# apply on just one axis
g_ymean = g.mean(axis=0)
g_xmean = g.mean(axis=1)
In [39]:
plt.plot(x, g_ymean)
Out[39]:
[]
In [40]:
plt.plot(g_xmean, y)
Out[40]:
[]

Fancy Plotting

Enough lessons, let's have some fun.

In [41]:
fig = plt.figure(figsize=(12,8))
ax1 = plt.subplot2grid((6,6),(0,1),colspan=5)
ax2 = plt.subplot2grid((6,6),(1,0),rowspan=5)
In [42]:
fig = plt.figure(figsize=(10,6))
ax1 = plt.subplot2grid((6,6),(0,1),colspan=5)
ax2 = plt.subplot2grid((6,6),(1,0),rowspan=5)
ax3 = plt.subplot2grid((6,6),(1,1),rowspan=5, colspan=5)

ax1.plot(x, g_ymean)
ax2.plot(g_xmean, y)
ax3.pcolormesh(x, y,  g)

ax1.set_xlim([x.min(), x.max()])
ax3.set_xlim([x.min(), x.max()])
ax2.set_ylim([y.min(), y.max()])
ax3.set_ylim([y.min(), y.max()])

plt.tight_layout()

Real Data

ARGO float profile from North Atlantic

In [45]:
# download with curl
!curl -O https://www.ldeo.columbia.edu/~rpa/argo_float_4901412.npz
  % Total    % Received % Xferd  Average Speed   Time    Time     Time  Current
                                 Dload  Upload   Total   Spent    Left  Speed
100  140k  100  140k    0     0  2252k      0 --:--:-- --:--:-- --:--:-- 2384k
In [46]:
# load numpy file and examine keys
data = np.load('argo_float_4901412.npz')
data.keys()
Out[46]:
['S', 'T', 'levels', 'lon', 'date', 'P', 'lat']
In [47]:
# access some data
T = data['T']
In [48]:
# there are "nans", missing data, which screw up our routines
T.min()
Out[48]:
nan
In [49]:
ar_w_mask = np.ma.masked_array([1, 2, 3, 4, 5],
                        mask=[True, True, False, False, False])
ar_w_mask
Out[49]:
masked_array(data = [-- -- 3 4 5],
             mask = [ True  True False False False],
       fill_value = 999999)
In [50]:
ar_w_mask.mean()
Out[50]:
4.0
In [51]:
T_ma = np.ma.masked_invalid(T)
T_ma.mean()
Out[51]:
11.104955983298781

Masked Arrays

This is how we deal with missing data in numpy

In [52]:
# create masked array
T = np.ma.masked_invalid(data['T'])
type(T)
Out[52]:
numpy.ma.core.MaskedArray
In [53]:
# max and min
T.max(), T.min()
Out[53]:
(24.364999771118164, 3.5320000648498535)
In [54]:
# load other data
S = np.ma.masked_invalid(data['S'])
P = np.ma.masked_invalid(data['P'])
In [55]:
# scatter plot
plt.scatter(S, T, c=P)
plt.grid()
plt.colorbar()
Out[55]:
In [ ]:
 
In [ ]: