Overturning Circulation
In the previous chapter, we examined the barotropic circulation by averaging out the vertical dimension. This allowed us to analyze the circulation in terms of a scalar streamfunction \(\psi\).
We will now do the same thing, but to remove the zonal dimension (i.e. x or longitude). This will reveal how the ocean moves mass in the latitude, depth plane.
Again assuming a rigid lid and no significant mass exchange with the atmosphere, we will integrate the continuity equation in the zonal direction. In this case, the integrals are over closed latitude circules.
Where the \(u\) term vanishes based on the fundamental theorem of calculus.
The two transport terms now form a 2D non-divergent flow in the y-z plane. That means we can represent them using a single streamfunction.
We will calculate \(\Psi\) from the ECCO data.
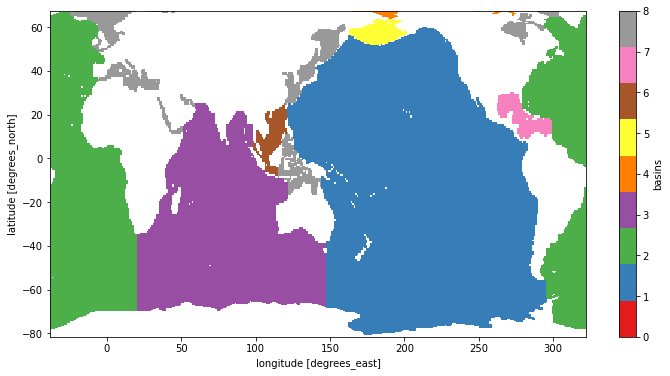
Breaking things down by basin
One disadvantage of creating a single \(\Psi\) for the global ocean is that we lose any specificity about where the transport is occuring. One way to overcome this is to create a distinct streamfunction for each basin. This is possible if we consider the \(u\) term, integrated between two longitudes \(x_1\) and \(x_2\) instead of around a closed latitude circle
If \(x_1\) and \(x_2\) are the meridional boundaries of the basin, the zonal velocity will vanish there, so that the \(u\) term will still vanish completely, leaving us with a 2D non-divergent transport.
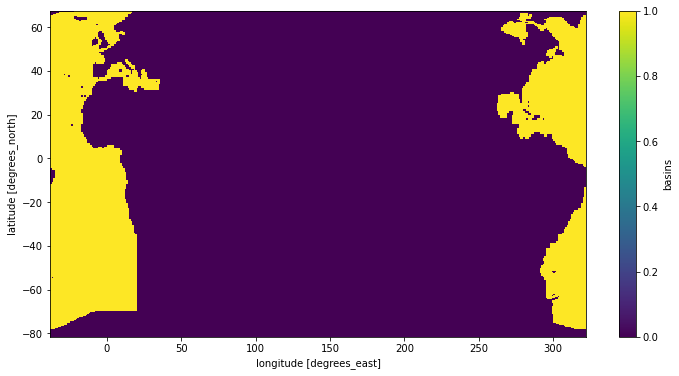
For the northern hemisphere, it’s typical to compute separate streamfunctions for the Atlantic and the Indo-Pacific. The total overturning is just their sum:
import xgcm
import xarray as xr
from matplotlib import pyplot as plt
import numpy as np
import hvplot.xarray

plt.rcParams['figure.figsize'] = (12, 6)
from intake import open_catalog
from xmitgcm.llcreader import faces_dataset_to_latlon

cat = open_catalog("https://raw.githubusercontent.com/pangeo-data/pangeo-datastore/master/intake-catalogs/ocean.yaml")
ds  = cat["ECCOv4r3"].to_dask()
ds
<xarray.Dataset>
Dimensions:    (time: 288, k_l: 50, face: 13, j: 90, i: 90, k: 50, i_g: 90, j_g: 90, time_snp: 287, k_p1: 51, k_u: 50)
Coordinates: (12/37)
    Depth      (face, j, i) float32 dask.array<chunksize=(13, 90, 90), meta=np.ndarray>
    PHrefC     (k) float32 dask.array<chunksize=(50,), meta=np.ndarray>
    PHrefF     (k_p1) float32 dask.array<chunksize=(51,), meta=np.ndarray>
    XC         (face, j, i) float32 dask.array<chunksize=(13, 90, 90), meta=np.ndarray>
    XG         (face, j_g, i_g) float32 dask.array<chunksize=(13, 90, 90), meta=np.ndarray>
    YC         (face, j, i) float32 dask.array<chunksize=(13, 90, 90), meta=np.ndarray>
    ...         ...
    rA         (face, j, i) float32 dask.array<chunksize=(13, 90, 90), meta=np.ndarray>
    rAs        (face, j_g, i) float32 dask.array<chunksize=(13, 90, 90), meta=np.ndarray>
    rAw        (face, j, i_g) float32 dask.array<chunksize=(13, 90, 90), meta=np.ndarray>
    rAz        (face, j_g, i_g) float32 dask.array<chunksize=(13, 90, 90), meta=np.ndarray>
  * time       (time) datetime64[ns] 1992-01-15 1992-02-13 ... 2015-12-14
  * time_snp   (time_snp) datetime64[ns] 1992-02-01 1992-03-01 ... 2015-12-01
Data variables: (12/36)
    ADVr_SLT   (time, k_l, face, j, i) float32 dask.array<chunksize=(1, 50, 13, 90, 90), meta=np.ndarray>
    ADVr_TH    (time, k_l, face, j, i) float32 dask.array<chunksize=(1, 50, 13, 90, 90), meta=np.ndarray>
    ADVx_SLT   (time, k, face, j, i_g) float32 dask.array<chunksize=(1, 50, 13, 90, 90), meta=np.ndarray>
    ADVx_TH    (time, k, face, j, i_g) float32 dask.array<chunksize=(1, 50, 13, 90, 90), meta=np.ndarray>
    ADVy_SLT   (time, k, face, j_g, i) float32 dask.array<chunksize=(1, 50, 13, 90, 90), meta=np.ndarray>
    ADVy_TH    (time, k, face, j_g, i) float32 dask.array<chunksize=(1, 50, 13, 90, 90), meta=np.ndarray>
    ...         ...
    basins     (face, j, i) int16 dask.array<chunksize=(1, 90, 90), meta=np.ndarray>
    oceFWflx   (time, face, j, i) float32 dask.array<chunksize=(1, 13, 90, 90), meta=np.ndarray>
    oceQsw     (time, face, j, i) float32 dask.array<chunksize=(1, 13, 90, 90), meta=np.ndarray>
    oceSPtnd   (time, k, face, j, i) float32 dask.array<chunksize=(1, 50, 13, 90, 90), meta=np.ndarray>
    oceTAUX    (time, face, j, i_g) float32 dask.array<chunksize=(1, 1, 90, 90), meta=np.ndarray>
oceTAUY (time, face, j_g, i) float32 dask.array<chunksize=(1, 1, 90, 90), meta=np.ndarray>- time: 288
- k_l: 50
- face: 13
- j: 90
- i: 90
- k: 50
- i_g: 90
- j_g: 90
- time_snp: 287
- k_p1: 51
- k_u: 50
- Depth(face, j, i)float32dask.array<chunksize=(13, 90, 90), meta=np.ndarray>
- coordinate :
- XC YC
- long_name :
- ocean depth
- standard_name :
- ocean_depth
- units :
- m
Array Chunk Bytes 411.33 kiB 411.33 kiB Shape (13, 90, 90) (13, 90, 90) Count 2 Tasks 1 Chunks Type float32 numpy.ndarray - PHrefC(k)float32dask.array<chunksize=(50,), meta=np.ndarray>
- long_name :
- Reference Hydrostatic Pressure
- standard_name :
- cell_reference_pressure
- units :
- m2 s-2
Array Chunk Bytes 200 B 200 B Shape (50,) (50,) Count 2 Tasks 1 Chunks Type float32 numpy.ndarray - PHrefF(k_p1)float32dask.array<chunksize=(51,), meta=np.ndarray>
- long_name :
- Reference Hydrostatic Pressure
- standard_name :
- cell_reference_pressure
- units :
- m2 s-2
Array Chunk Bytes 204 B 204 B Shape (51,) (51,) Count 2 Tasks 1 Chunks Type float32 numpy.ndarray - XC(face, j, i)float32dask.array<chunksize=(13, 90, 90), meta=np.ndarray>
- coordinate :
- YC XC
- long_name :
- longitude
- standard_name :
- longitude
- units :
- degrees_east
Array Chunk Bytes 411.33 kiB 411.33 kiB Shape (13, 90, 90) (13, 90, 90) Count 2 Tasks 1 Chunks Type float32 numpy.ndarray - XG(face, j_g, i_g)float32dask.array<chunksize=(13, 90, 90), meta=np.ndarray>
- coordinate :
- YG XG
- long_name :
- longitude
- standard_name :
- longitude_at_f_location
- units :
- degrees_east
Array Chunk Bytes 411.33 kiB 411.33 kiB Shape (13, 90, 90) (13, 90, 90) Count 2 Tasks 1 Chunks Type float32 numpy.ndarray - YC(face, j, i)float32dask.array<chunksize=(13, 90, 90), meta=np.ndarray>
- coordinate :
- YC XC
- long_name :
- latitude
- standard_name :
- latitude
- units :
- degrees_north
Array Chunk Bytes 411.33 kiB 411.33 kiB Shape (13, 90, 90) (13, 90, 90) Count 2 Tasks 1 Chunks Type float32 numpy.ndarray - YG(face, j_g, i_g)float32dask.array<chunksize=(13, 90, 90), meta=np.ndarray>
- long_name :
- latitude
- standard_name :
- latitude_at_f_location
- units :
- degrees_north
Array Chunk Bytes 411.33 kiB 411.33 kiB Shape (13, 90, 90) (13, 90, 90) Count 2 Tasks 1 Chunks Type float32 numpy.ndarray - Z(k)float32dask.array<chunksize=(50,), meta=np.ndarray>
- long_name :
- vertical coordinate of cell center
- positive :
- down
- standard_name :
- depth
- units :
- m
Array Chunk Bytes 200 B 200 B Shape (50,) (50,) Count 2 Tasks 1 Chunks Type float32 numpy.ndarray - Zl(k_l)float32dask.array<chunksize=(50,), meta=np.ndarray>
- long_name :
- vertical coordinate of upper cell interface
- positive :
- down
- standard_name :
- depth_at_upper_w_location
- units :
- m
Array Chunk Bytes 200 B 200 B Shape (50,) (50,) Count 2 Tasks 1 Chunks Type float32 numpy.ndarray - Zp1(k_p1)float32dask.array<chunksize=(51,), meta=np.ndarray>
- long_name :
- vertical coordinate of cell interface
- positive :
- down
- standard_name :
- depth_at_w_location
- units :
- m
Array Chunk Bytes 204 B 204 B Shape (51,) (51,) Count 2 Tasks 1 Chunks Type float32 numpy.ndarray - Zu(k_u)float32dask.array<chunksize=(50,), meta=np.ndarray>
- long_name :
- vertical coordinate of lower cell interface
- positive :
- down
- standard_name :
- depth_at_lower_w_location
- units :
- m
Array Chunk Bytes 200 B 200 B Shape (50,) (50,) Count 2 Tasks 1 Chunks Type float32 numpy.ndarray - drC(k_p1)float32dask.array<chunksize=(51,), meta=np.ndarray>
- long_name :
- cell z size
- standard_name :
- cell_z_size_at_w_location
- units :
- m
Array Chunk Bytes 204 B 204 B Shape (51,) (51,) Count 2 Tasks 1 Chunks Type float32 numpy.ndarray - drF(k)float32dask.array<chunksize=(50,), meta=np.ndarray>
- long_name :
- cell z size
- standard_name :
- cell_z_size
- units :
- m
Array Chunk Bytes 200 B 200 B Shape (50,) (50,) Count 2 Tasks 1 Chunks Type float32 numpy.ndarray - dxC(face, j, i_g)float32dask.array<chunksize=(13, 90, 90), meta=np.ndarray>
- coordinate :
- YC XG
- long_name :
- cell x size
- standard_name :
- cell_x_size_at_u_location
- units :
- m
Array Chunk Bytes 411.33 kiB 411.33 kiB Shape (13, 90, 90) (13, 90, 90) Count 2 Tasks 1 Chunks Type float32 numpy.ndarray - dxG(face, j_g, i)float32dask.array<chunksize=(13, 90, 90), meta=np.ndarray>
- coordinate :
- YG XC
- long_name :
- cell x size
- standard_name :
- cell_x_size_at_v_location
- units :
- m
Array Chunk Bytes 411.33 kiB 411.33 kiB Shape (13, 90, 90) (13, 90, 90) Count 2 Tasks 1 Chunks Type float32 numpy.ndarray - dyC(face, j_g, i)float32dask.array<chunksize=(13, 90, 90), meta=np.ndarray>
- coordinate :
- YG XC
- long_name :
- cell y size
- standard_name :
- cell_y_size_at_v_location
- units :
- m
Array Chunk Bytes 411.33 kiB 411.33 kiB Shape (13, 90, 90) (13, 90, 90) Count 2 Tasks 1 Chunks Type float32 numpy.ndarray - dyG(face, j, i_g)float32dask.array<chunksize=(13, 90, 90), meta=np.ndarray>
- coordinate :
- YC XG
- long_name :
- cell y size
- standard_name :
- cell_y_size_at_u_location
- units :
- m
Array Chunk Bytes 411.33 kiB 411.33 kiB Shape (13, 90, 90) (13, 90, 90) Count 2 Tasks 1 Chunks Type float32 numpy.ndarray - face(face)int640 1 2 3 4 5 6 7 8 9 10 11 12
- standard_name :
- face_index
array([ 0, 1, 2, 3, 4, 5, 6, 7, 8, 9, 10, 11, 12])
- hFacC(k, face, j, i)float32dask.array<chunksize=(50, 13, 90, 90), meta=np.ndarray>
- long_name :
- vertical fraction of open cell
- standard_name :
- cell_vertical_fraction
Array Chunk Bytes 20.08 MiB 20.08 MiB Shape (50, 13, 90, 90) (50, 13, 90, 90) Count 2 Tasks 1 Chunks Type float32 numpy.ndarray - hFacS(k, face, j_g, i)float32dask.array<chunksize=(50, 13, 90, 90), meta=np.ndarray>
- long_name :
- vertical fraction of open cell
- standard_name :
- cell_vertical_fraction_at_v_location
Array Chunk Bytes 20.08 MiB 20.08 MiB Shape (50, 13, 90, 90) (50, 13, 90, 90) Count 2 Tasks 1 Chunks Type float32 numpy.ndarray - hFacW(k, face, j, i_g)float32dask.array<chunksize=(50, 13, 90, 90), meta=np.ndarray>
- long_name :
- vertical fraction of open cell
- standard_name :
- cell_vertical_fraction_at_u_location
Array Chunk Bytes 20.08 MiB 20.08 MiB Shape (50, 13, 90, 90) (50, 13, 90, 90) Count 2 Tasks 1 Chunks Type float32 numpy.ndarray - i(i)int640 1 2 3 4 5 6 ... 84 85 86 87 88 89
- axis :
- X
- long_name :
- x-dimension of the t grid
- standard_name :
- x_grid_index
- swap_dim :
- XC
array([ 0, 1, 2, 3, 4, 5, 6, 7, 8, 9, 10, 11, 12, 13, 14, 15, 16, 17, 18, 19, 20, 21, 22, 23, 24, 25, 26, 27, 28, 29, 30, 31, 32, 33, 34, 35, 36, 37, 38, 39, 40, 41, 42, 43, 44, 45, 46, 47, 48, 49, 50, 51, 52, 53, 54, 55, 56, 57, 58, 59, 60, 61, 62, 63, 64, 65, 66, 67, 68, 69, 70, 71, 72, 73, 74, 75, 76, 77, 78, 79, 80, 81, 82, 83, 84, 85, 86, 87, 88, 89]) - i_g(i_g)int640 1 2 3 4 5 6 ... 84 85 86 87 88 89
- axis :
- X
- c_grid_axis_shift :
- -0.5
- long_name :
- x-dimension of the u grid
- standard_name :
- x_grid_index_at_u_location
- swap_dim :
- XG
array([ 0, 1, 2, 3, 4, 5, 6, 7, 8, 9, 10, 11, 12, 13, 14, 15, 16, 17, 18, 19, 20, 21, 22, 23, 24, 25, 26, 27, 28, 29, 30, 31, 32, 33, 34, 35, 36, 37, 38, 39, 40, 41, 42, 43, 44, 45, 46, 47, 48, 49, 50, 51, 52, 53, 54, 55, 56, 57, 58, 59, 60, 61, 62, 63, 64, 65, 66, 67, 68, 69, 70, 71, 72, 73, 74, 75, 76, 77, 78, 79, 80, 81, 82, 83, 84, 85, 86, 87, 88, 89]) - iter(time)int64dask.array<chunksize=(1,), meta=np.ndarray>
- long_name :
- model timestep number
- standard_name :
- timestep
Array Chunk Bytes 2.25 kiB 8 B Shape (288,) (1,) Count 289 Tasks 288 Chunks Type int64 numpy.ndarray - iter_snp(time_snp)int64dask.array<chunksize=(1,), meta=np.ndarray>
- long_name :
- model timestep number
- standard_name :
- timestep
Array Chunk Bytes 2.24 kiB 8 B Shape (287,) (1,) Count 288 Tasks 287 Chunks Type int64 numpy.ndarray - j(j)int640 1 2 3 4 5 6 ... 84 85 86 87 88 89
- axis :
- Y
- long_name :
- y-dimension of the t grid
- standard_name :
- y_grid_index
- swap_dim :
- YC
array([ 0, 1, 2, 3, 4, 5, 6, 7, 8, 9, 10, 11, 12, 13, 14, 15, 16, 17, 18, 19, 20, 21, 22, 23, 24, 25, 26, 27, 28, 29, 30, 31, 32, 33, 34, 35, 36, 37, 38, 39, 40, 41, 42, 43, 44, 45, 46, 47, 48, 49, 50, 51, 52, 53, 54, 55, 56, 57, 58, 59, 60, 61, 62, 63, 64, 65, 66, 67, 68, 69, 70, 71, 72, 73, 74, 75, 76, 77, 78, 79, 80, 81, 82, 83, 84, 85, 86, 87, 88, 89]) - j_g(j_g)int640 1 2 3 4 5 6 ... 84 85 86 87 88 89
- axis :
- Y
- c_grid_axis_shift :
- -0.5
- long_name :
- y-dimension of the v grid
- standard_name :
- y_grid_index_at_v_location
- swap_dim :
- YG
array([ 0, 1, 2, 3, 4, 5, 6, 7, 8, 9, 10, 11, 12, 13, 14, 15, 16, 17, 18, 19, 20, 21, 22, 23, 24, 25, 26, 27, 28, 29, 30, 31, 32, 33, 34, 35, 36, 37, 38, 39, 40, 41, 42, 43, 44, 45, 46, 47, 48, 49, 50, 51, 52, 53, 54, 55, 56, 57, 58, 59, 60, 61, 62, 63, 64, 65, 66, 67, 68, 69, 70, 71, 72, 73, 74, 75, 76, 77, 78, 79, 80, 81, 82, 83, 84, 85, 86, 87, 88, 89]) - k(k)int640 1 2 3 4 5 6 ... 44 45 46 47 48 49
- axis :
- Z
- long_name :
- z-dimension of the t grid
- standard_name :
- z_grid_index
- swap_dim :
- Z
array([ 0, 1, 2, 3, 4, 5, 6, 7, 8, 9, 10, 11, 12, 13, 14, 15, 16, 17, 18, 19, 20, 21, 22, 23, 24, 25, 26, 27, 28, 29, 30, 31, 32, 33, 34, 35, 36, 37, 38, 39, 40, 41, 42, 43, 44, 45, 46, 47, 48, 49]) - k_l(k_l)int640 1 2 3 4 5 6 ... 44 45 46 47 48 49
- axis :
- Z
- c_grid_axis_shift :
- -0.5
- long_name :
- z-dimension of the w grid
- standard_name :
- z_grid_index_at_upper_w_location
- swap_dim :
- Zl
array([ 0, 1, 2, 3, 4, 5, 6, 7, 8, 9, 10, 11, 12, 13, 14, 15, 16, 17, 18, 19, 20, 21, 22, 23, 24, 25, 26, 27, 28, 29, 30, 31, 32, 33, 34, 35, 36, 37, 38, 39, 40, 41, 42, 43, 44, 45, 46, 47, 48, 49]) - k_p1(k_p1)int640 1 2 3 4 5 6 ... 45 46 47 48 49 50
- axis :
- Z
- c_grid_axis_shift :
- [-0.5, 0.5]
- long_name :
- z-dimension of the w grid
- standard_name :
- z_grid_index_at_w_location
- swap_dim :
- Zp1
array([ 0, 1, 2, 3, 4, 5, 6, 7, 8, 9, 10, 11, 12, 13, 14, 15, 16, 17, 18, 19, 20, 21, 22, 23, 24, 25, 26, 27, 28, 29, 30, 31, 32, 33, 34, 35, 36, 37, 38, 39, 40, 41, 42, 43, 44, 45, 46, 47, 48, 49, 50]) - k_u(k_u)int640 1 2 3 4 5 6 ... 44 45 46 47 48 49
- axis :
- Z
- c_grid_axis_shift :
- 0.5
- long_name :
- z-dimension of the w grid
- standard_name :
- z_grid_index_at_lower_w_location
- swap_dim :
- Zu
array([ 0, 1, 2, 3, 4, 5, 6, 7, 8, 9, 10, 11, 12, 13, 14, 15, 16, 17, 18, 19, 20, 21, 22, 23, 24, 25, 26, 27, 28, 29, 30, 31, 32, 33, 34, 35, 36, 37, 38, 39, 40, 41, 42, 43, 44, 45, 46, 47, 48, 49]) - rA(face, j, i)float32dask.array<chunksize=(13, 90, 90), meta=np.ndarray>
- coordinate :
- YC XC
- long_name :
- cell area
- standard_name :
- cell_area
- units :
- m2
Array Chunk Bytes 411.33 kiB 411.33 kiB Shape (13, 90, 90) (13, 90, 90) Count 2 Tasks 1 Chunks Type float32 numpy.ndarray - rAs(face, j_g, i)float32dask.array<chunksize=(13, 90, 90), meta=np.ndarray>
- long_name :
- cell area
- standard_name :
- cell_area_at_v_location
- units :
- m2
Array Chunk Bytes 411.33 kiB 411.33 kiB Shape (13, 90, 90) (13, 90, 90) Count 2 Tasks 1 Chunks Type float32 numpy.ndarray - rAw(face, j, i_g)float32dask.array<chunksize=(13, 90, 90), meta=np.ndarray>
- coordinate :
- YG XC
- long_name :
- cell area
- standard_name :
- cell_area_at_u_location
- units :
- m2
Array Chunk Bytes 411.33 kiB 411.33 kiB Shape (13, 90, 90) (13, 90, 90) Count 2 Tasks 1 Chunks Type float32 numpy.ndarray - rAz(face, j_g, i_g)float32dask.array<chunksize=(13, 90, 90), meta=np.ndarray>
- coordinate :
- YG XG
- long_name :
- cell area
- standard_name :
- cell_area_at_f_location
- units :
- m
Array Chunk Bytes 411.33 kiB 411.33 kiB Shape (13, 90, 90) (13, 90, 90) Count 2 Tasks 1 Chunks Type float32 numpy.ndarray - time(time)datetime64[ns]1992-01-15 ... 2015-12-14
- axis :
- T
- long_name :
- Time
- standard_name :
- time
array(['1992-01-15T00:00:00.000000000', '1992-02-13T00:00:00.000000000', '1992-03-15T00:00:00.000000000', ..., '2015-10-15T00:00:00.000000000', '2015-11-14T00:00:00.000000000', '2015-12-14T00:00:00.000000000'], dtype='datetime64[ns]') - time_snp(time_snp)datetime64[ns]1992-02-01 ... 2015-12-01
- axis :
- T
- c_grid_axis_shift :
- 0.5
- long_name :
- Time
- standard_name :
- time
array(['1992-02-01T00:00:00.000000000', '1992-03-01T00:00:00.000000000',
       '1992-04-01T00:00:00.000000000', ..., '2015-10-01T00:00:00.000000000',
       '2015-11-01T00:00:00.000000000', '2015-12-01T00:00:00.000000000'],
      dtype='datetime64[ns]')
- ADVr_SLT(time, k_l, face, j, i)float32dask.array<chunksize=(1, 50, 13, 90, 90), meta=np.ndarray>
- long_name :
- Vertical Advective Flux of Salinity
- standard_name :
- ADVr_SLT
- units :
- psu.m^3/s
Array Chunk Bytes 5.65 GiB 20.08 MiB Shape (288, 50, 13, 90, 90) (1, 50, 13, 90, 90) Count 289 Tasks 288 Chunks Type float32 numpy.ndarray - ADVr_TH(time, k_l, face, j, i)float32dask.array<chunksize=(1, 50, 13, 90, 90), meta=np.ndarray>
- long_name :
- Vertical Advective Flux of Pot.Temperature
- standard_name :
- ADVr_TH
- units :
- degC.m^3/s
Array Chunk Bytes 5.65 GiB 20.08 MiB Shape (288, 50, 13, 90, 90) (1, 50, 13, 90, 90) Count 289 Tasks 288 Chunks Type float32 numpy.ndarray - ADVx_SLT(time, k, face, j, i_g)float32dask.array<chunksize=(1, 50, 13, 90, 90), meta=np.ndarray>
- long_name :
- Zonal Advective Flux of Salinity
- mate :
- ADVy_SLT
- standard_name :
- ADVx_SLT
- units :
- psu.m^3/s
Array Chunk Bytes 5.65 GiB 20.08 MiB Shape (288, 50, 13, 90, 90) (1, 50, 13, 90, 90) Count 289 Tasks 288 Chunks Type float32 numpy.ndarray - ADVx_TH(time, k, face, j, i_g)float32dask.array<chunksize=(1, 50, 13, 90, 90), meta=np.ndarray>
- long_name :
- Zonal Advective Flux of Pot.Temperature
- mate :
- ADVy_TH
- standard_name :
- ADVx_TH
- units :
- degC.m^3/s
Array Chunk Bytes 5.65 GiB 20.08 MiB Shape (288, 50, 13, 90, 90) (1, 50, 13, 90, 90) Count 289 Tasks 288 Chunks Type float32 numpy.ndarray - ADVy_SLT(time, k, face, j_g, i)float32dask.array<chunksize=(1, 50, 13, 90, 90), meta=np.ndarray>
- long_name :
- Meridional Advective Flux of Salinity
- mate :
- ADVx_SLT
- standard_name :
- ADVy_SLT
- units :
- psu.m^3/s
Array Chunk Bytes 5.65 GiB 20.08 MiB Shape (288, 50, 13, 90, 90) (1, 50, 13, 90, 90) Count 289 Tasks 288 Chunks Type float32 numpy.ndarray - ADVy_TH(time, k, face, j_g, i)float32dask.array<chunksize=(1, 50, 13, 90, 90), meta=np.ndarray>
- long_name :
- Meridional Advective Flux of Pot.Temperature
- mate :
- ADVx_TH
- standard_name :
- ADVy_TH
- units :
- degC.m^3/s
Array Chunk Bytes 5.65 GiB 20.08 MiB Shape (288, 50, 13, 90, 90) (1, 50, 13, 90, 90) Count 289 Tasks 288 Chunks Type float32 numpy.ndarray - DFrE_SLT(time, k_l, face, j, i)float32dask.array<chunksize=(1, 50, 13, 90, 90), meta=np.ndarray>
- long_name :
- Vertical Diffusive Flux of Salinity (Explicit part)
- standard_name :
- DFrE_SLT
- units :
- psu.m^3/s
Array Chunk Bytes 5.65 GiB 20.08 MiB Shape (288, 50, 13, 90, 90) (1, 50, 13, 90, 90) Count 289 Tasks 288 Chunks Type float32 numpy.ndarray - DFrE_TH(time, k_l, face, j, i)float32dask.array<chunksize=(1, 50, 13, 90, 90), meta=np.ndarray>
- long_name :
- Vertical Diffusive Flux of Pot.Temperature (Explicit part)
- standard_name :
- DFrE_TH
- units :
- degC.m^3/s
Array Chunk Bytes 5.65 GiB 20.08 MiB Shape (288, 50, 13, 90, 90) (1, 50, 13, 90, 90) Count 289 Tasks 288 Chunks Type float32 numpy.ndarray - DFrI_SLT(time, k_l, face, j, i)float32dask.array<chunksize=(1, 50, 13, 90, 90), meta=np.ndarray>
- long_name :
- Vertical Diffusive Flux of Salinity (Implicit part)
- standard_name :
- DFrI_SLT
- units :
- psu.m^3/s
Array Chunk Bytes 5.65 GiB 20.08 MiB Shape (288, 50, 13, 90, 90) (1, 50, 13, 90, 90) Count 289 Tasks 288 Chunks Type float32 numpy.ndarray - DFrI_TH(time, k_l, face, j, i)float32dask.array<chunksize=(1, 50, 13, 90, 90), meta=np.ndarray>
- long_name :
- Vertical Diffusive Flux of Pot.Temperature (Implicit part)
- standard_name :
- DFrI_TH
- units :
- degC.m^3/s
Array Chunk Bytes 5.65 GiB 20.08 MiB Shape (288, 50, 13, 90, 90) (1, 50, 13, 90, 90) Count 289 Tasks 288 Chunks Type float32 numpy.ndarray - DFxE_SLT(time, k, face, j, i_g)float32dask.array<chunksize=(1, 50, 13, 90, 90), meta=np.ndarray>
- long_name :
- Zonal Diffusive Flux of Salinity
- mate :
- DFyE_SLT
- standard_name :
- DFxE_SLT
- units :
- psu.m^3/s
Array Chunk Bytes 5.65 GiB 20.08 MiB Shape (288, 50, 13, 90, 90) (1, 50, 13, 90, 90) Count 289 Tasks 288 Chunks Type float32 numpy.ndarray - DFxE_TH(time, k, face, j, i_g)float32dask.array<chunksize=(1, 50, 13, 90, 90), meta=np.ndarray>
- long_name :
- Zonal Diffusive Flux of Pot.Temperature
- mate :
- DFyE_TH
- standard_name :
- DFxE_TH
- units :
- degC.m^3/s
Array Chunk Bytes 5.65 GiB 20.08 MiB Shape (288, 50, 13, 90, 90) (1, 50, 13, 90, 90) Count 289 Tasks 288 Chunks Type float32 numpy.ndarray - DFyE_SLT(time, k, face, j_g, i)float32dask.array<chunksize=(1, 50, 13, 90, 90), meta=np.ndarray>
- long_name :
- Meridional Diffusive Flux of Salinity
- mate :
- DFxE_SLT
- standard_name :
- DFyE_SLT
- units :
- psu.m^3/s
Array Chunk Bytes 5.65 GiB 20.08 MiB Shape (288, 50, 13, 90, 90) (1, 50, 13, 90, 90) Count 289 Tasks 288 Chunks Type float32 numpy.ndarray - DFyE_TH(time, k, face, j_g, i)float32dask.array<chunksize=(1, 50, 13, 90, 90), meta=np.ndarray>
- long_name :
- Meridional Diffusive Flux of Pot.Temperature
- mate :
- DFxE_TH
- standard_name :
- DFyE_TH
- units :
- degC.m^3/s
Array Chunk Bytes 5.65 GiB 20.08 MiB Shape (288, 50, 13, 90, 90) (1, 50, 13, 90, 90) Count 289 Tasks 288 Chunks Type float32 numpy.ndarray - ETAN(time, face, j, i)float32dask.array<chunksize=(1, 13, 90, 90), meta=np.ndarray>
- long_name :
- Surface Height Anomaly
- standard_name :
- ETAN
- units :
- m
Array Chunk Bytes 115.69 MiB 411.33 kiB Shape (288, 13, 90, 90) (1, 13, 90, 90) Count 289 Tasks 288 Chunks Type float32 numpy.ndarray - ETAN_snp(time_snp, face, j, i)float32dask.array<chunksize=(1, 13, 90, 90), meta=np.ndarray>
- long_name :
- Surface Height Anomaly
- standard_name :
- ETAN
- units :
- m
Array Chunk Bytes 115.28 MiB 411.33 kiB Shape (287, 13, 90, 90) (1, 13, 90, 90) Count 288 Tasks 287 Chunks Type float32 numpy.ndarray - GEOFLX(face, j, i)float32dask.array<chunksize=(7, 90, 90), meta=np.ndarray>
Array Chunk Bytes 411.33 kiB 221.48 kiB Shape (13, 90, 90) (7, 90, 90) Count 3 Tasks 2 Chunks Type float32 numpy.ndarray - MXLDEPTH(time, face, j, i)float32dask.array<chunksize=(1, 1, 90, 90), meta=np.ndarray>
- coordinates :
- SN dt iter XC Depth YC CS rA
- long_name :
- Mixed-Layer Depth (>0)
- standard_name :
- MXLDEPTH
- units :
- m
Array Chunk Bytes 115.69 MiB 31.64 kiB Shape (288, 13, 90, 90) (1, 1, 90, 90) Count 3745 Tasks 3744 Chunks Type float32 numpy.ndarray - SALT(time, k, face, j, i)float32dask.array<chunksize=(1, 50, 13, 90, 90), meta=np.ndarray>
- long_name :
- Salinity
- standard_name :
- SALT
- units :
- psu
Array Chunk Bytes 5.65 GiB 20.08 MiB Shape (288, 50, 13, 90, 90) (1, 50, 13, 90, 90) Count 289 Tasks 288 Chunks Type float32 numpy.ndarray - SALT_snp(time_snp, k, face, j, i)float32dask.array<chunksize=(1, 50, 13, 90, 90), meta=np.ndarray>
- long_name :
- Salinity
- standard_name :
- SALT
- units :
- psu
Array Chunk Bytes 5.63 GiB 20.08 MiB Shape (287, 50, 13, 90, 90) (1, 50, 13, 90, 90) Count 288 Tasks 287 Chunks Type float32 numpy.ndarray - SFLUX(time, face, j, i)float32dask.array<chunksize=(1, 13, 90, 90), meta=np.ndarray>
- long_name :
- total salt flux (match salt-content variations), >0 increases salt
- standard_name :
- SFLUX
- units :
- g/m^2/s
Array Chunk Bytes 115.69 MiB 411.33 kiB Shape (288, 13, 90, 90) (1, 13, 90, 90) Count 289 Tasks 288 Chunks Type float32 numpy.ndarray - TFLUX(time, face, j, i)float32dask.array<chunksize=(1, 13, 90, 90), meta=np.ndarray>
- long_name :
- total heat flux (match heat-content variations), >0 increases theta
- standard_name :
- TFLUX
- units :
- W/m^2
Array Chunk Bytes 115.69 MiB 411.33 kiB Shape (288, 13, 90, 90) (1, 13, 90, 90) Count 289 Tasks 288 Chunks Type float32 numpy.ndarray - THETA(time, k, face, j, i)float32dask.array<chunksize=(1, 50, 13, 90, 90), meta=np.ndarray>
- long_name :
- Potential Temperature
- standard_name :
- THETA
- units :
- degC
Array Chunk Bytes 5.65 GiB 20.08 MiB Shape (288, 50, 13, 90, 90) (1, 50, 13, 90, 90) Count 289 Tasks 288 Chunks Type float32 numpy.ndarray - THETA_snp(time_snp, k, face, j, i)float32dask.array<chunksize=(1, 50, 13, 90, 90), meta=np.ndarray>
- long_name :
- Potential Temperature
- standard_name :
- THETA
- units :
- degC
Array Chunk Bytes 5.63 GiB 20.08 MiB Shape (287, 50, 13, 90, 90) (1, 50, 13, 90, 90) Count 288 Tasks 287 Chunks Type float32 numpy.ndarray - UVELMASS(time, k, face, j, i_g)float32dask.array<chunksize=(1, 50, 13, 90, 90), meta=np.ndarray>
- long_name :
- Zonal Mass-Weighted Comp of Velocity (m/s)
- mate :
- VVELMASS
- standard_name :
- UVELMASS
- units :
- m/s
Array Chunk Bytes 5.65 GiB 20.08 MiB Shape (288, 50, 13, 90, 90) (1, 50, 13, 90, 90) Count 289 Tasks 288 Chunks Type float32 numpy.ndarray - UVELSTAR(time, k, face, j, i_g)float32dask.array<chunksize=(1, 50, 1, 90, 90), meta=np.ndarray>
- coordinates :
- hFacW dt PHrefC Z iter dxC drF rAw dyG
- long_name :
- Zonal Component of Bolus Velocity
- mate :
- VVELSTAR
- standard_name :
- UVELSTAR
- units :
- m/s
Array Chunk Bytes 5.65 GiB 1.54 MiB Shape (288, 50, 13, 90, 90) (1, 50, 1, 90, 90) Count 3745 Tasks 3744 Chunks Type float32 numpy.ndarray - VVELMASS(time, k, face, j_g, i)float32dask.array<chunksize=(1, 50, 13, 90, 90), meta=np.ndarray>
- long_name :
- Meridional Mass-Weighted Comp of Velocity (m/s)
- mate :
- UVELMASS
- standard_name :
- VVELMASS
- units :
- m/s
Array Chunk Bytes 5.65 GiB 20.08 MiB Shape (288, 50, 13, 90, 90) (1, 50, 13, 90, 90) Count 289 Tasks 288 Chunks Type float32 numpy.ndarray - VVELSTAR(time, k, face, j_g, i)float32dask.array<chunksize=(1, 50, 1, 90, 90), meta=np.ndarray>
- coordinates :
- dt PHrefC Z iter dxG rAs hFacS dyC drF
- long_name :
- Meridional Component of Bolus Velocity
- mate :
- UVELSTAR
- standard_name :
- VVELSTAR
- units :
- m/s
Array Chunk Bytes 5.65 GiB 1.54 MiB Shape (288, 50, 13, 90, 90) (1, 50, 1, 90, 90) Count 3745 Tasks 3744 Chunks Type float32 numpy.ndarray - WVELMASS(time, k_l, face, j, i)float32dask.array<chunksize=(1, 50, 13, 90, 90), meta=np.ndarray>
- long_name :
- Vertical Mass-Weighted Comp of Velocity
- standard_name :
- WVELMASS
- units :
- m/s
Array Chunk Bytes 5.65 GiB 20.08 MiB Shape (288, 50, 13, 90, 90) (1, 50, 13, 90, 90) Count 289 Tasks 288 Chunks Type float32 numpy.ndarray - WVELSTAR(time, k_l, face, j, i)float32dask.array<chunksize=(1, 50, 1, 90, 90), meta=np.ndarray>
- coordinates :
- Zl SN dt iter XC Depth YC CS rA
- long_name :
- Vertical Component of Bolus Velocity
- standard_name :
- WVELSTAR
- units :
- m/s
Array Chunk Bytes 5.65 GiB 1.54 MiB Shape (288, 50, 13, 90, 90) (1, 50, 1, 90, 90) Count 3745 Tasks 3744 Chunks Type float32 numpy.ndarray - basins(face, j, i)int16dask.array<chunksize=(1, 90, 90), meta=np.ndarray>
Array Chunk Bytes 205.66 kiB 15.82 kiB Shape (13, 90, 90) (1, 90, 90) Count 14 Tasks 13 Chunks Type int16 numpy.ndarray - oceFWflx(time, face, j, i)float32dask.array<chunksize=(1, 13, 90, 90), meta=np.ndarray>
- long_name :
- net surface Fresh-Water flux into the ocean (+=down), >0 decreases salinity
- standard_name :
- oceFWflx
- units :
- kg/m^2/s
Array Chunk Bytes 115.69 MiB 411.33 kiB Shape (288, 13, 90, 90) (1, 13, 90, 90) Count 289 Tasks 288 Chunks Type float32 numpy.ndarray - oceQsw(time, face, j, i)float32dask.array<chunksize=(1, 13, 90, 90), meta=np.ndarray>
- long_name :
- net Short-Wave radiation (+=down), >0 increases theta
- standard_name :
- oceQsw
- units :
- W/m^2
Array Chunk Bytes 115.69 MiB 411.33 kiB Shape (288, 13, 90, 90) (1, 13, 90, 90) Count 289 Tasks 288 Chunks Type float32 numpy.ndarray - oceSPtnd(time, k, face, j, i)float32dask.array<chunksize=(1, 50, 13, 90, 90), meta=np.ndarray>
- long_name :
- salt tendency due to salt plume flux >0 increases salinity
- standard_name :
- oceSPtnd
- units :
- g/m^2/s
Array Chunk Bytes 5.65 GiB 20.08 MiB Shape (288, 50, 13, 90, 90) (1, 50, 13, 90, 90) Count 289 Tasks 288 Chunks Type float32 numpy.ndarray - oceTAUX(time, face, j, i_g)float32dask.array<chunksize=(1, 1, 90, 90), meta=np.ndarray>
- coordinates :
- dt iter dxC rAw dyG
- long_name :
- zonal surface wind stress, >0 increases uVel
- mate :
- oceTAUY
- standard_name :
- oceTAUX
- units :
- N/m^2
Array Chunk Bytes 115.69 MiB 31.64 kiB Shape (288, 13, 90, 90) (1, 1, 90, 90) Count 3745 Tasks 3744 Chunks Type float32 numpy.ndarray - oceTAUY(time, face, j_g, i)float32dask.array<chunksize=(1, 1, 90, 90), meta=np.ndarray>
- coordinates :
- dt dxG iter rAs dyC
- long_name :
- meridional surf. wind stress, >0 increases vVel
- mate :
- oceTAUX
- standard_name :
- oceTAUY
- units :
- N/m^2
Array Chunk Bytes 115.69 MiB 31.64 kiB Shape (288, 13, 90, 90) (1, 1, 90, 90) Count 3745 Tasks 3744 Chunks Type float32 numpy.ndarray
from dask_gateway import Gateway
gway = Gateway()
cluster = gway.new_cluster()
cluster
/srv/conda/envs/notebook/lib/python3.8/site-packages/dask_gateway/client.py:21: FutureWarning: format_bytes is deprecated and will be removed in a future release. Please use dask.utils.format_bytes instead.
  from distributed.utils import LoopRunner, format_bytes
# convert to lat-lon grid
ds = ds.set_coords(['basins'])
ds = faces_dataset_to_latlon(ds)
# trim y dimension
ds = ds.isel(j=slice(30,None), j_g=slice(30, None))

new_coords = {
    'lon_c': ds.XC[100].reset_coords(drop=True),
    'lon_g': ds.XG[100].reset_coords(drop=True),
    'lat_c': ds.YC[:, 0].reset_coords(drop=True),
    'lat_g': ds.YG[:, 0].reset_coords(drop=True)
}
ds = ds.assign_coords(new_coords)
for c in new_coords:
    ds[c].load()

# fix non-monotonic lat lon
ds.lon_c.data[ds.lon_c.data < ds.lon_c.data[0]] += 360
ds.lon_g.data[ds.lon_g.data < ds.lon_g.data[0]] += 360

swap_dims = {
    'i': 'lon_c', 'j': 'lat_c', 'i_g': 'lon_g', 'j_g': 'lat_g',
    'k': 'Z', 'k_l': 'Zl', 'k_u': 'Zu', 'k_p1': 'Zp1'
}

ds = ds.swap_dims(swap_dims)

attrs_to_swap = ['axis', 'c_grid_axis_shift']
for orig, new in swap_dims.items():
    for a in attrs_to_swap:
        if a in ds[orig].attrs:
            ds[new].attrs[a] = ds[orig].attrs[a]

ds
<xarray.Dataset>
Dimensions:    (face: 13, lon_c: 360, lon_g: 360, lat_c: 240, lat_g: 240, Z: 50, Zl: 50, Zp1: 51, Zu: 50, time: 288, time_snp: 287)
Coordinates: (12/42)
  * face       (face) int64 0 1 2 3 4 5 6 7 8 9 10 11 12
    i          (lon_c) int64 0 1 2 3 4 5 6 7 ... 352 353 354 355 356 357 358 359
    i_g        (lon_g) int64 0 1 2 3 4 5 6 7 ... 352 353 354 355 356 357 358 359
    j          (lat_c) int64 30 31 32 33 34 35 36 ... 264 265 266 267 268 269
    j_g        (lat_g) int64 30 31 32 33 34 35 36 ... 264 265 266 267 268 269
    k          (Z) int64 0 1 2 3 4 5 6 7 8 9 ... 40 41 42 43 44 45 46 47 48 49
    ...         ...
    dyG        (lat_c, lon_g) float32 dask.array<chunksize=(60, 90), meta=np.ndarray>
    dxG        (lat_g, lon_c) float32 dask.array<chunksize=(60, 90), meta=np.ndarray>
  * lon_c      (lon_c) float32 -37.5 -36.5 -35.5 -34.5 ... 319.5 320.5 321.5
  * lon_g      (lon_g) float32 -38.0 -37.0 -36.0 -35.0 ... 319.0 320.0 321.0
  * lat_c      (lat_c) float32 -81.46 -81.13 -80.8 -80.45 ... 67.16 67.34 67.47
  * lat_g      (lat_g) float32 -81.61 -81.28 -80.95 -80.61 ... 67.06 67.25 67.4
Data variables: (12/35)
    ADVr_SLT   (time, Zl, lat_c, lon_c) float32 dask.array<chunksize=(1, 50, 60, 90), meta=np.ndarray>
    ADVr_TH    (time, Zl, lat_c, lon_c) float32 dask.array<chunksize=(1, 50, 60, 90), meta=np.ndarray>
    DFrE_SLT   (time, Zl, lat_c, lon_c) float32 dask.array<chunksize=(1, 50, 60, 90), meta=np.ndarray>
    DFrE_TH    (time, Zl, lat_c, lon_c) float32 dask.array<chunksize=(1, 50, 60, 90), meta=np.ndarray>
    DFrI_SLT   (time, Zl, lat_c, lon_c) float32 dask.array<chunksize=(1, 50, 60, 90), meta=np.ndarray>
    DFrI_TH    (time, Zl, lat_c, lon_c) float32 dask.array<chunksize=(1, 50, 60, 90), meta=np.ndarray>
    ...         ...
    UVELMASS   (time, Z, lat_c, lon_g) float32 dask.array<chunksize=(1, 50, 60, 90), meta=np.ndarray>
    VVELMASS   (time, Z, lat_g, lon_c) float32 dask.array<chunksize=(1, 50, 60, 90), meta=np.ndarray>
    UVELSTAR   (time, Z, lat_c, lon_g) float32 dask.array<chunksize=(1, 50, 60, 90), meta=np.ndarray>
    VVELSTAR   (time, Z, lat_g, lon_c) float32 dask.array<chunksize=(1, 50, 60, 90), meta=np.ndarray>
    oceTAUX    (time, lat_c, lon_g) float32 dask.array<chunksize=(1, 60, 90), meta=np.ndarray>
oceTAUY (time, lat_g, lon_c) float32 dask.array<chunksize=(1, 60, 90), meta=np.ndarray>- face: 13
- lon_c: 360
- lon_g: 360
- lat_c: 240
- lat_g: 240
- Z: 50
- Zl: 50
- Zp1: 51
- Zu: 50
- time: 288
- time_snp: 287
- face(face)int640 1 2 3 4 5 6 7 8 9 10 11 12
- standard_name :
- face_index
array([ 0, 1, 2, 3, 4, 5, 6, 7, 8, 9, 10, 11, 12])
- i(lon_c)int640 1 2 3 4 5 ... 355 356 357 358 359
- axis :
- X
- long_name :
- x-dimension of the t grid
- standard_name :
- x_grid_index
- swap_dim :
- XC
array([ 0, 1, 2, ..., 357, 358, 359])
- i_g(lon_g)int640 1 2 3 4 5 ... 355 356 357 358 359
- axis :
- X
- c_grid_axis_shift :
- -0.5
- long_name :
- x-dimension of the u grid
- standard_name :
- x_grid_index_at_u_location
- swap_dim :
- XG
array([ 0, 1, 2, ..., 357, 358, 359])
- j(lat_c)int6430 31 32 33 34 ... 266 267 268 269
- axis :
- Y
- long_name :
- y-dimension of the t grid
- standard_name :
- y_grid_index
- swap_dim :
- YC
array([ 30, 31, 32, ..., 267, 268, 269])
- j_g(lat_g)int6430 31 32 33 34 ... 266 267 268 269
- axis :
- Y
- c_grid_axis_shift :
- -0.5
- long_name :
- y-dimension of the v grid
- standard_name :
- y_grid_index_at_v_location
- swap_dim :
- YG
array([ 30, 31, 32, ..., 267, 268, 269])
- k(Z)int640 1 2 3 4 5 6 ... 44 45 46 47 48 49
- axis :
- Z
- long_name :
- z-dimension of the t grid
- standard_name :
- z_grid_index
- swap_dim :
- Z
array([ 0, 1, 2, 3, 4, 5, 6, 7, 8, 9, 10, 11, 12, 13, 14, 15, 16, 17, 18, 19, 20, 21, 22, 23, 24, 25, 26, 27, 28, 29, 30, 31, 32, 33, 34, 35, 36, 37, 38, 39, 40, 41, 42, 43, 44, 45, 46, 47, 48, 49]) - k_l(Zl)int640 1 2 3 4 5 6 ... 44 45 46 47 48 49
- axis :
- Z
- c_grid_axis_shift :
- -0.5
- long_name :
- z-dimension of the w grid
- standard_name :
- z_grid_index_at_upper_w_location
- swap_dim :
- Zl
array([ 0, 1, 2, 3, 4, 5, 6, 7, 8, 9, 10, 11, 12, 13, 14, 15, 16, 17, 18, 19, 20, 21, 22, 23, 24, 25, 26, 27, 28, 29, 30, 31, 32, 33, 34, 35, 36, 37, 38, 39, 40, 41, 42, 43, 44, 45, 46, 47, 48, 49]) - k_p1(Zp1)int640 1 2 3 4 5 6 ... 45 46 47 48 49 50
- axis :
- Z
- c_grid_axis_shift :
- [-0.5, 0.5]
- long_name :
- z-dimension of the w grid
- standard_name :
- z_grid_index_at_w_location
- swap_dim :
- Zp1
array([ 0, 1, 2, 3, 4, 5, 6, 7, 8, 9, 10, 11, 12, 13, 14, 15, 16, 17, 18, 19, 20, 21, 22, 23, 24, 25, 26, 27, 28, 29, 30, 31, 32, 33, 34, 35, 36, 37, 38, 39, 40, 41, 42, 43, 44, 45, 46, 47, 48, 49, 50]) - k_u(Zu)int640 1 2 3 4 5 6 ... 44 45 46 47 48 49
- axis :
- Z
- c_grid_axis_shift :
- 0.5
- long_name :
- z-dimension of the w grid
- standard_name :
- z_grid_index_at_lower_w_location
- swap_dim :
- Zu
array([ 0, 1, 2, 3, 4, 5, 6, 7, 8, 9, 10, 11, 12, 13, 14, 15, 16, 17, 18, 19, 20, 21, 22, 23, 24, 25, 26, 27, 28, 29, 30, 31, 32, 33, 34, 35, 36, 37, 38, 39, 40, 41, 42, 43, 44, 45, 46, 47, 48, 49]) - time(time)datetime64[ns]1992-01-15 ... 2015-12-14
- axis :
- T
- long_name :
- Time
- standard_name :
- time
array(['1992-01-15T00:00:00.000000000', '1992-02-13T00:00:00.000000000', '1992-03-15T00:00:00.000000000', ..., '2015-10-15T00:00:00.000000000', '2015-11-14T00:00:00.000000000', '2015-12-14T00:00:00.000000000'], dtype='datetime64[ns]') - time_snp(time_snp)datetime64[ns]1992-02-01 ... 2015-12-01
- axis :
- T
- c_grid_axis_shift :
- 0.5
- long_name :
- Time
- standard_name :
- time
array(['1992-02-01T00:00:00.000000000', '1992-03-01T00:00:00.000000000', '1992-04-01T00:00:00.000000000', ..., '2015-10-01T00:00:00.000000000', '2015-11-01T00:00:00.000000000', '2015-12-01T00:00:00.000000000'], dtype='datetime64[ns]') - Depth(lat_c, lon_c)float32dask.array<chunksize=(60, 90), meta=np.ndarray>
- coordinate :
- XC YC
- long_name :
- ocean depth
- standard_name :
- ocean_depth
- units :
- m
Array Chunk Bytes 337.50 kiB 31.64 kiB Shape (240, 360) (90, 90) Count 74 Tasks 12 Chunks Type float32 numpy.ndarray - PHrefC(Z)float32dask.array<chunksize=(50,), meta=np.ndarray>
- long_name :
- Reference Hydrostatic Pressure
- standard_name :
- cell_reference_pressure
- units :
- m2 s-2
Array Chunk Bytes 200 B 200 B Shape (50,) (50,) Count 2 Tasks 1 Chunks Type float32 numpy.ndarray - PHrefF(Zp1)float32dask.array<chunksize=(51,), meta=np.ndarray>
- long_name :
- Reference Hydrostatic Pressure
- standard_name :
- cell_reference_pressure
- units :
- m2 s-2
Array Chunk Bytes 204 B 204 B Shape (51,) (51,) Count 2 Tasks 1 Chunks Type float32 numpy.ndarray - XC(lat_c, lon_c)float32dask.array<chunksize=(60, 90), meta=np.ndarray>
- coordinate :
- YC XC
- long_name :
- longitude
- standard_name :
- longitude
- units :
- degrees_east
Array Chunk Bytes 337.50 kiB 31.64 kiB Shape (240, 360) (90, 90) Count 74 Tasks 12 Chunks Type float32 numpy.ndarray - XG(lat_g, lon_g)float32dask.array<chunksize=(60, 90), meta=np.ndarray>
- coordinate :
- YG XG
- long_name :
- longitude
- standard_name :
- longitude_at_f_location
- units :
- degrees_east
Array Chunk Bytes 337.50 kiB 31.64 kiB Shape (240, 360) (90, 90) Count 74 Tasks 12 Chunks Type float32 numpy.ndarray - YC(lat_c, lon_c)float32dask.array<chunksize=(60, 90), meta=np.ndarray>
- coordinate :
- YC XC
- long_name :
- latitude
- standard_name :
- latitude
- units :
- degrees_north
Array Chunk Bytes 337.50 kiB 31.64 kiB Shape (240, 360) (90, 90) Count 74 Tasks 12 Chunks Type float32 numpy.ndarray - YG(lat_g, lon_g)float32dask.array<chunksize=(60, 90), meta=np.ndarray>
- long_name :
- latitude
- standard_name :
- latitude_at_f_location
- units :
- degrees_north
Array Chunk Bytes 337.50 kiB 31.64 kiB Shape (240, 360) (90, 90) Count 74 Tasks 12 Chunks Type float32 numpy.ndarray - Z(Z)float32-5.0 -15.0 ... -5.906e+03
- long_name :
- vertical coordinate of cell center
- positive :
- down
- standard_name :
- depth
- units :
- m
- axis :
- Z
array([-5.000000e+00, -1.500000e+01, -2.500000e+01, -3.500000e+01, -4.500000e+01, -5.500000e+01, -6.500000e+01, -7.500500e+01, -8.502500e+01, -9.509500e+01, -1.053100e+02, -1.158700e+02, -1.271500e+02, -1.397400e+02, -1.544700e+02, -1.724000e+02, -1.947350e+02, -2.227100e+02, -2.574700e+02, -2.999300e+02, -3.506800e+02, -4.099300e+02, -4.774700e+02, -5.527100e+02, -6.347350e+02, -7.224000e+02, -8.144700e+02, -9.097400e+02, -1.007155e+03, -1.105905e+03, -1.205535e+03, -1.306205e+03, -1.409150e+03, -1.517095e+03, -1.634175e+03, -1.765135e+03, -1.914150e+03, -2.084035e+03, -2.276225e+03, -2.491250e+03, -2.729250e+03, -2.990250e+03, -3.274250e+03, -3.581250e+03, -3.911250e+03, -4.264250e+03, -4.640250e+03, -5.039250e+03, -5.461250e+03, -5.906250e+03], dtype=float32) - Zl(Zl)float320.0 -10.0 ... -5.244e+03 -5.678e+03
- long_name :
- vertical coordinate of upper cell interface
- positive :
- down
- standard_name :
- depth_at_upper_w_location
- units :
- m
- axis :
- Z
- c_grid_axis_shift :
- -0.5
array([ 0. , -10. , -20. , -30. , -40. , -50. , -60. , -70. , -80.01, -90.04, -100.15, -110.47, -121.27, -133.03, -146.45, -162.49, -182.31, -207.16, -238.26, -276.68, -323.18, -378.18, -441.68, -513.26, -592.16, -677.31, -767.49, -861.45, -958.03, -1056.28, -1155.53, -1255.54, -1356.87, -1461.43, -1572.76, -1695.59, -1834.68, -1993.62, -2174.45, -2378. , -2604.5 , -2854. , -3126.5 , -3422. , -3740.5 , -4082. , -4446.5 , -4834. , -5244.5 , -5678. ], dtype=float32) - Zp1(Zp1)float320.0 -10.0 ... -5.678e+03 -6.134e+03
- long_name :
- vertical coordinate of cell interface
- positive :
- down
- standard_name :
- depth_at_w_location
- units :
- m
- axis :
- Z
- c_grid_axis_shift :
- [-0.5, 0.5]
array([ 0. , -10. , -20. , -30. , -40. , -50. , -60. , -70. , -80.01, -90.04, -100.15, -110.47, -121.27, -133.03, -146.45, -162.49, -182.31, -207.16, -238.26, -276.68, -323.18, -378.18, -441.68, -513.26, -592.16, -677.31, -767.49, -861.45, -958.03, -1056.28, -1155.53, -1255.54, -1356.87, -1461.43, -1572.76, -1695.59, -1834.68, -1993.62, -2174.45, -2378. , -2604.5 , -2854. , -3126.5 , -3422. , -3740.5 , -4082. , -4446.5 , -4834. , -5244.5 , -5678. , -6134.5 ], dtype=float32) - Zu(Zu)float32-10.0 -20.0 ... -6.134e+03
- long_name :
- vertical coordinate of lower cell interface
- positive :
- down
- standard_name :
- depth_at_lower_w_location
- units :
- m
- axis :
- Z
- c_grid_axis_shift :
- 0.5
array([ -10. , -20. , -30. , -40. , -50. , -60. , -70. , -80.01, -90.04, -100.15, -110.47, -121.27, -133.03, -146.45, -162.49, -182.31, -207.16, -238.26, -276.68, -323.18, -378.18, -441.68, -513.26, -592.16, -677.31, -767.49, -861.45, -958.03, -1056.28, -1155.53, -1255.54, -1356.87, -1461.43, -1572.76, -1695.59, -1834.68, -1993.62, -2174.45, -2378. , -2604.5 , -2854. , -3126.5 , -3422. , -3740.5 , -4082. , -4446.5 , -4834. , -5244.5 , -5678. , -6134.5 ], dtype=float32) - basins(lat_c, lon_c)int16dask.array<chunksize=(60, 90), meta=np.ndarray>
Array Chunk Bytes 168.75 kiB 15.82 kiB Shape (240, 360) (90, 90) Count 86 Tasks 12 Chunks Type int16 numpy.ndarray - drC(Zp1)float32dask.array<chunksize=(51,), meta=np.ndarray>
- long_name :
- cell z size
- standard_name :
- cell_z_size_at_w_location
- units :
- m
Array Chunk Bytes 204 B 204 B Shape (51,) (51,) Count 2 Tasks 1 Chunks Type float32 numpy.ndarray - drF(Z)float32dask.array<chunksize=(50,), meta=np.ndarray>
- long_name :
- cell z size
- standard_name :
- cell_z_size
- units :
- m
Array Chunk Bytes 200 B 200 B Shape (50,) (50,) Count 2 Tasks 1 Chunks Type float32 numpy.ndarray - hFacC(Z, lat_c, lon_c)float32dask.array<chunksize=(50, 60, 90), meta=np.ndarray>
- long_name :
- vertical fraction of open cell
- standard_name :
- cell_vertical_fraction
Array Chunk Bytes 16.48 MiB 1.54 MiB Shape (50, 240, 360) (50, 90, 90) Count 74 Tasks 12 Chunks Type float32 numpy.ndarray - hFacS(Z, lat_g, lon_c)float32dask.array<chunksize=(50, 60, 90), meta=np.ndarray>
- long_name :
- vertical fraction of open cell
- standard_name :
- cell_vertical_fraction_at_v_location
Array Chunk Bytes 16.48 MiB 1.54 MiB Shape (50, 240, 360) (50, 90, 90) Count 74 Tasks 12 Chunks Type float32 numpy.ndarray - hFacW(Z, lat_c, lon_g)float32dask.array<chunksize=(50, 60, 90), meta=np.ndarray>
- long_name :
- vertical fraction of open cell
- standard_name :
- cell_vertical_fraction_at_u_location
Array Chunk Bytes 16.48 MiB 1.54 MiB Shape (50, 240, 360) (50, 90, 90) Count 74 Tasks 12 Chunks Type float32 numpy.ndarray - iter(time)int64dask.array<chunksize=(1,), meta=np.ndarray>
- long_name :
- model timestep number
- standard_name :
- timestep
Array Chunk Bytes 2.25 kiB 8 B Shape (288,) (1,) Count 289 Tasks 288 Chunks Type int64 numpy.ndarray - iter_snp(time_snp)int64dask.array<chunksize=(1,), meta=np.ndarray>
- long_name :
- model timestep number
- standard_name :
- timestep
Array Chunk Bytes 2.24 kiB 8 B Shape (287,) (1,) Count 288 Tasks 287 Chunks Type int64 numpy.ndarray - rA(lat_c, lon_c)float32dask.array<chunksize=(60, 90), meta=np.ndarray>
- coordinate :
- YC XC
- long_name :
- cell area
- standard_name :
- cell_area
- units :
- m2
Array Chunk Bytes 337.50 kiB 31.64 kiB Shape (240, 360) (90, 90) Count 74 Tasks 12 Chunks Type float32 numpy.ndarray - rAs(lat_g, lon_c)float32dask.array<chunksize=(60, 90), meta=np.ndarray>
- long_name :
- cell area
- standard_name :
- cell_area_at_v_location
- units :
- m2
Array Chunk Bytes 337.50 kiB 31.64 kiB Shape (240, 360) (90, 90) Count 74 Tasks 12 Chunks Type float32 numpy.ndarray - rAw(lat_c, lon_g)float32dask.array<chunksize=(60, 90), meta=np.ndarray>
- coordinate :
- YG XC
- long_name :
- cell area
- standard_name :
- cell_area_at_u_location
- units :
- m2
Array Chunk Bytes 337.50 kiB 31.64 kiB Shape (240, 360) (90, 90) Count 74 Tasks 12 Chunks Type float32 numpy.ndarray - rAz(lat_g, lon_g)float32dask.array<chunksize=(60, 90), meta=np.ndarray>
- coordinate :
- YG XG
- long_name :
- cell area
- standard_name :
- cell_area_at_f_location
- units :
- m
Array Chunk Bytes 337.50 kiB 31.64 kiB Shape (240, 360) (90, 90) Count 74 Tasks 12 Chunks Type float32 numpy.ndarray - dxC(lat_c, lon_g)float32dask.array<chunksize=(60, 90), meta=np.ndarray>
- coordinate :
- YC XG
- long_name :
- cell x size
- standard_name :
- cell_x_size_at_u_location
- units :
- m
Array Chunk Bytes 337.50 kiB 31.64 kiB Shape (240, 360) (90, 90) Count 76 Tasks 12 Chunks Type float32 numpy.ndarray - dyC(lat_g, lon_c)float32dask.array<chunksize=(60, 90), meta=np.ndarray>
- coordinate :
- YG XC
- long_name :
- cell y size
- standard_name :
- cell_y_size_at_v_location
- units :
- m
Array Chunk Bytes 337.50 kiB 31.29 kiB Shape (240, 360) (89, 90) Count 159 Tasks 20 Chunks Type float32 numpy.ndarray - dyG(lat_c, lon_g)float32dask.array<chunksize=(60, 90), meta=np.ndarray>
- coordinate :
- YC XG
- long_name :
- cell y size
- standard_name :
- cell_y_size_at_u_location
- units :
- m
Array Chunk Bytes 337.50 kiB 31.64 kiB Shape (240, 360) (90, 90) Count 76 Tasks 12 Chunks Type float32 numpy.ndarray - dxG(lat_g, lon_c)float32dask.array<chunksize=(60, 90), meta=np.ndarray>
- coordinate :
- YG XC
- long_name :
- cell x size
- standard_name :
- cell_x_size_at_v_location
- units :
- m
Array Chunk Bytes 337.50 kiB 31.29 kiB Shape (240, 360) (89, 90) Count 159 Tasks 20 Chunks Type float32 numpy.ndarray - lon_c(lon_c)float32-37.5 -36.5 -35.5 ... 320.5 321.5
- coordinate :
- YC XC
- long_name :
- longitude
- standard_name :
- longitude
- units :
- degrees_east
- axis :
- X
array([-37.5, -36.5, -35.5, ..., 319.5, 320.5, 321.5], dtype=float32)
- lon_g(lon_g)float32-38.0 -37.0 -36.0 ... 320.0 321.0
- coordinate :
- YG XG
- long_name :
- longitude
- standard_name :
- longitude_at_f_location
- units :
- degrees_east
- axis :
- X
- c_grid_axis_shift :
- -0.5
array([-38., -37., -36., ..., 319., 320., 321.], dtype=float32)
- lat_c(lat_c)float32-81.46 -81.13 -80.8 ... 67.34 67.47
- coordinate :
- YC XC
- long_name :
- latitude
- standard_name :
- latitude
- units :
- degrees_north
- axis :
- Y
array([-81.46223, -81.13084, -80.79505, ..., 67.16407, 67.33552, 67.47211], dtype=float32) - lat_g(lat_g)float32-81.61 -81.28 -80.95 ... 67.25 67.4
- long_name :
- latitude
- standard_name :
- latitude_at_f_location
- units :
- degrees_north
- axis :
- Y
- c_grid_axis_shift :
- -0.5
array([-81.61184 , -81.283295, -80.95029 , ...,  67.06448 ,  67.24895 ,
        67.40169 ], dtype=float32)
- ADVr_SLT(time, Zl, lat_c, lon_c)float32dask.array<chunksize=(1, 50, 60, 90), meta=np.ndarray>
- long_name :
- Vertical Advective Flux of Salinity
- standard_name :
- ADVr_SLT
- units :
- psu.m^3/s
Array Chunk Bytes 4.63 GiB 1.54 MiB Shape (288, 50, 240, 360) (1, 50, 90, 90) Count 21025 Tasks 3456 Chunks Type float32 numpy.ndarray - ADVr_TH(time, Zl, lat_c, lon_c)float32dask.array<chunksize=(1, 50, 60, 90), meta=np.ndarray>
- long_name :
- Vertical Advective Flux of Pot.Temperature
- standard_name :
- ADVr_TH
- units :
- degC.m^3/s
Array Chunk Bytes 4.63 GiB 1.54 MiB Shape (288, 50, 240, 360) (1, 50, 90, 90) Count 21025 Tasks 3456 Chunks Type float32 numpy.ndarray - DFrE_SLT(time, Zl, lat_c, lon_c)float32dask.array<chunksize=(1, 50, 60, 90), meta=np.ndarray>
- long_name :
- Vertical Diffusive Flux of Salinity (Explicit part)
- standard_name :
- DFrE_SLT
- units :
- psu.m^3/s
Array Chunk Bytes 4.63 GiB 1.54 MiB Shape (288, 50, 240, 360) (1, 50, 90, 90) Count 21025 Tasks 3456 Chunks Type float32 numpy.ndarray - DFrE_TH(time, Zl, lat_c, lon_c)float32dask.array<chunksize=(1, 50, 60, 90), meta=np.ndarray>
- long_name :
- Vertical Diffusive Flux of Pot.Temperature (Explicit part)
- standard_name :
- DFrE_TH
- units :
- degC.m^3/s
Array Chunk Bytes 4.63 GiB 1.54 MiB Shape (288, 50, 240, 360) (1, 50, 90, 90) Count 21025 Tasks 3456 Chunks Type float32 numpy.ndarray - DFrI_SLT(time, Zl, lat_c, lon_c)float32dask.array<chunksize=(1, 50, 60, 90), meta=np.ndarray>
- long_name :
- Vertical Diffusive Flux of Salinity (Implicit part)
- standard_name :
- DFrI_SLT
- units :
- psu.m^3/s
Array Chunk Bytes 4.63 GiB 1.54 MiB Shape (288, 50, 240, 360) (1, 50, 90, 90) Count 21025 Tasks 3456 Chunks Type float32 numpy.ndarray - DFrI_TH(time, Zl, lat_c, lon_c)float32dask.array<chunksize=(1, 50, 60, 90), meta=np.ndarray>
- long_name :
- Vertical Diffusive Flux of Pot.Temperature (Implicit part)
- standard_name :
- DFrI_TH
- units :
- degC.m^3/s
Array Chunk Bytes 4.63 GiB 1.54 MiB Shape (288, 50, 240, 360) (1, 50, 90, 90) Count 21025 Tasks 3456 Chunks Type float32 numpy.ndarray - ETAN(time, lat_c, lon_c)float32dask.array<chunksize=(1, 60, 90), meta=np.ndarray>
- long_name :
- Surface Height Anomaly
- standard_name :
- ETAN
- units :
- m
Array Chunk Bytes 94.92 MiB 31.64 kiB Shape (288, 240, 360) (1, 90, 90) Count 21025 Tasks 3456 Chunks Type float32 numpy.ndarray - ETAN_snp(time_snp, lat_c, lon_c)float32dask.array<chunksize=(1, 60, 90), meta=np.ndarray>
- long_name :
- Surface Height Anomaly
- standard_name :
- ETAN
- units :
- m
Array Chunk Bytes 94.59 MiB 31.64 kiB Shape (287, 240, 360) (1, 90, 90) Count 20952 Tasks 3444 Chunks Type float32 numpy.ndarray - GEOFLX(lat_c, lon_c)float32dask.array<chunksize=(60, 90), meta=np.ndarray>
Array Chunk Bytes 337.50 kiB 31.64 kiB Shape (240, 360) (90, 90) Count 75 Tasks 12 Chunks Type float32 numpy.ndarray - MXLDEPTH(time, lat_c, lon_c)float32dask.array<chunksize=(1, 60, 90), meta=np.ndarray>
- coordinates :
- SN dt iter XC Depth YC CS rA
- long_name :
- Mixed-Layer Depth (>0)
- standard_name :
- MXLDEPTH
- units :
- m
Array Chunk Bytes 94.92 MiB 31.64 kiB Shape (288, 240, 360) (1, 90, 90) Count 24481 Tasks 3456 Chunks Type float32 numpy.ndarray - SALT(time, Z, lat_c, lon_c)float32dask.array<chunksize=(1, 50, 60, 90), meta=np.ndarray>
- long_name :
- Salinity
- standard_name :
- SALT
- units :
- psu
Array Chunk Bytes 4.63 GiB 1.54 MiB Shape (288, 50, 240, 360) (1, 50, 90, 90) Count 21025 Tasks 3456 Chunks Type float32 numpy.ndarray - SALT_snp(time_snp, Z, lat_c, lon_c)float32dask.array<chunksize=(1, 50, 60, 90), meta=np.ndarray>
- long_name :
- Salinity
- standard_name :
- SALT
- units :
- psu
Array Chunk Bytes 4.62 GiB 1.54 MiB Shape (287, 50, 240, 360) (1, 50, 90, 90) Count 20952 Tasks 3444 Chunks Type float32 numpy.ndarray - SFLUX(time, lat_c, lon_c)float32dask.array<chunksize=(1, 60, 90), meta=np.ndarray>
- long_name :
- total salt flux (match salt-content variations), >0 increases salt
- standard_name :
- SFLUX
- units :
- g/m^2/s
Array Chunk Bytes 94.92 MiB 31.64 kiB Shape (288, 240, 360) (1, 90, 90) Count 21025 Tasks 3456 Chunks Type float32 numpy.ndarray - TFLUX(time, lat_c, lon_c)float32dask.array<chunksize=(1, 60, 90), meta=np.ndarray>
- long_name :
- total heat flux (match heat-content variations), >0 increases theta
- standard_name :
- TFLUX
- units :
- W/m^2
Array Chunk Bytes 94.92 MiB 31.64 kiB Shape (288, 240, 360) (1, 90, 90) Count 21025 Tasks 3456 Chunks Type float32 numpy.ndarray - THETA(time, Z, lat_c, lon_c)float32dask.array<chunksize=(1, 50, 60, 90), meta=np.ndarray>
- long_name :
- Potential Temperature
- standard_name :
- THETA
- units :
- degC
Array Chunk Bytes 4.63 GiB 1.54 MiB Shape (288, 50, 240, 360) (1, 50, 90, 90) Count 21025 Tasks 3456 Chunks Type float32 numpy.ndarray - THETA_snp(time_snp, Z, lat_c, lon_c)float32dask.array<chunksize=(1, 50, 60, 90), meta=np.ndarray>
- long_name :
- Potential Temperature
- standard_name :
- THETA
- units :
- degC
Array Chunk Bytes 4.62 GiB 1.54 MiB Shape (287, 50, 240, 360) (1, 50, 90, 90) Count 20952 Tasks 3444 Chunks Type float32 numpy.ndarray - WVELMASS(time, Zl, lat_c, lon_c)float32dask.array<chunksize=(1, 50, 60, 90), meta=np.ndarray>
- long_name :
- Vertical Mass-Weighted Comp of Velocity
- standard_name :
- WVELMASS
- units :
- m/s
Array Chunk Bytes 4.63 GiB 1.54 MiB Shape (288, 50, 240, 360) (1, 50, 90, 90) Count 21025 Tasks 3456 Chunks Type float32 numpy.ndarray - WVELSTAR(time, Zl, lat_c, lon_c)float32dask.array<chunksize=(1, 50, 60, 90), meta=np.ndarray>
- coordinates :
- Zl SN dt iter XC Depth YC CS rA
- long_name :
- Vertical Component of Bolus Velocity
- standard_name :
- WVELSTAR
- units :
- m/s
Array Chunk Bytes 4.63 GiB 1.54 MiB Shape (288, 50, 240, 360) (1, 50, 90, 90) Count 24481 Tasks 3456 Chunks Type float32 numpy.ndarray - oceFWflx(time, lat_c, lon_c)float32dask.array<chunksize=(1, 60, 90), meta=np.ndarray>
- long_name :
- net surface Fresh-Water flux into the ocean (+=down), >0 decreases salinity
- standard_name :
- oceFWflx
- units :
- kg/m^2/s
Array Chunk Bytes 94.92 MiB 31.64 kiB Shape (288, 240, 360) (1, 90, 90) Count 21025 Tasks 3456 Chunks Type float32 numpy.ndarray - oceQsw(time, lat_c, lon_c)float32dask.array<chunksize=(1, 60, 90), meta=np.ndarray>
- long_name :
- net Short-Wave radiation (+=down), >0 increases theta
- standard_name :
- oceQsw
- units :
- W/m^2
Array Chunk Bytes 94.92 MiB 31.64 kiB Shape (288, 240, 360) (1, 90, 90) Count 21025 Tasks 3456 Chunks Type float32 numpy.ndarray - oceSPtnd(time, Z, lat_c, lon_c)float32dask.array<chunksize=(1, 50, 60, 90), meta=np.ndarray>
- long_name :
- salt tendency due to salt plume flux >0 increases salinity
- standard_name :
- oceSPtnd
- units :
- g/m^2/s
Array Chunk Bytes 4.63 GiB 1.54 MiB Shape (288, 50, 240, 360) (1, 50, 90, 90) Count 21025 Tasks 3456 Chunks Type float32 numpy.ndarray - ADVx_SLT(time, Z, lat_c, lon_g)float32dask.array<chunksize=(1, 50, 60, 90), meta=np.ndarray>
- long_name :
- Zonal Advective Flux of Salinity
- mate :
- ADVy_SLT
- standard_name :
- ADVx_SLT
- units :
- psu.m^3/s
Array Chunk Bytes 4.63 GiB 1.54 MiB Shape (288, 50, 240, 360) (1, 50, 90, 90) Count 21314 Tasks 3456 Chunks Type float32 numpy.ndarray - ADVy_SLT(time, Z, lat_g, lon_c)float32dask.array<chunksize=(1, 50, 60, 90), meta=np.ndarray>
- long_name :
- Meridional Advective Flux of Salinity
- mate :
- ADVx_SLT
- standard_name :
- ADVy_SLT
- units :
- psu.m^3/s
Array Chunk Bytes 4.63 GiB 1.53 MiB Shape (288, 50, 240, 360) (1, 50, 89, 90) Count 47522 Tasks 5760 Chunks Type float32 numpy.ndarray - ADVx_TH(time, Z, lat_c, lon_g)float32dask.array<chunksize=(1, 50, 60, 90), meta=np.ndarray>
- long_name :
- Zonal Advective Flux of Pot.Temperature
- mate :
- ADVy_TH
- standard_name :
- ADVx_TH
- units :
- degC.m^3/s
Array Chunk Bytes 4.63 GiB 1.54 MiB Shape (288, 50, 240, 360) (1, 50, 90, 90) Count 21314 Tasks 3456 Chunks Type float32 numpy.ndarray - ADVy_TH(time, Z, lat_g, lon_c)float32dask.array<chunksize=(1, 50, 60, 90), meta=np.ndarray>
- long_name :
- Meridional Advective Flux of Pot.Temperature
- mate :
- ADVx_TH
- standard_name :
- ADVy_TH
- units :
- degC.m^3/s
Array Chunk Bytes 4.63 GiB 1.53 MiB Shape (288, 50, 240, 360) (1, 50, 89, 90) Count 47522 Tasks 5760 Chunks Type float32 numpy.ndarray - DFxE_SLT(time, Z, lat_c, lon_g)float32dask.array<chunksize=(1, 50, 60, 90), meta=np.ndarray>
- long_name :
- Zonal Diffusive Flux of Salinity
- mate :
- DFyE_SLT
- standard_name :
- DFxE_SLT
- units :
- psu.m^3/s
Array Chunk Bytes 4.63 GiB 1.54 MiB Shape (288, 50, 240, 360) (1, 50, 90, 90) Count 21314 Tasks 3456 Chunks Type float32 numpy.ndarray - DFyE_SLT(time, Z, lat_g, lon_c)float32dask.array<chunksize=(1, 50, 60, 90), meta=np.ndarray>
- long_name :
- Meridional Diffusive Flux of Salinity
- mate :
- DFxE_SLT
- standard_name :
- DFyE_SLT
- units :
- psu.m^3/s
Array Chunk Bytes 4.63 GiB 1.53 MiB Shape (288, 50, 240, 360) (1, 50, 89, 90) Count 47522 Tasks 5760 Chunks Type float32 numpy.ndarray - DFxE_TH(time, Z, lat_c, lon_g)float32dask.array<chunksize=(1, 50, 60, 90), meta=np.ndarray>
- long_name :
- Zonal Diffusive Flux of Pot.Temperature
- mate :
- DFyE_TH
- standard_name :
- DFxE_TH
- units :
- degC.m^3/s
Array Chunk Bytes 4.63 GiB 1.54 MiB Shape (288, 50, 240, 360) (1, 50, 90, 90) Count 21314 Tasks 3456 Chunks Type float32 numpy.ndarray - DFyE_TH(time, Z, lat_g, lon_c)float32dask.array<chunksize=(1, 50, 60, 90), meta=np.ndarray>
- long_name :
- Meridional Diffusive Flux of Pot.Temperature
- mate :
- DFxE_TH
- standard_name :
- DFyE_TH
- units :
- degC.m^3/s
Array Chunk Bytes 4.63 GiB 1.53 MiB Shape (288, 50, 240, 360) (1, 50, 89, 90) Count 47522 Tasks 5760 Chunks Type float32 numpy.ndarray - UVELMASS(time, Z, lat_c, lon_g)float32dask.array<chunksize=(1, 50, 60, 90), meta=np.ndarray>
- long_name :
- Zonal Mass-Weighted Comp of Velocity (m/s)
- mate :
- VVELMASS
- standard_name :
- UVELMASS
- units :
- m/s
Array Chunk Bytes 4.63 GiB 1.54 MiB Shape (288, 50, 240, 360) (1, 50, 90, 90) Count 21314 Tasks 3456 Chunks Type float32 numpy.ndarray - VVELMASS(time, Z, lat_g, lon_c)float32dask.array<chunksize=(1, 50, 60, 90), meta=np.ndarray>
- long_name :
- Meridional Mass-Weighted Comp of Velocity (m/s)
- mate :
- UVELMASS
- standard_name :
- VVELMASS
- units :
- m/s
Array Chunk Bytes 4.63 GiB 1.53 MiB Shape (288, 50, 240, 360) (1, 50, 89, 90) Count 47522 Tasks 5760 Chunks Type float32 numpy.ndarray - UVELSTAR(time, Z, lat_c, lon_g)float32dask.array<chunksize=(1, 50, 60, 90), meta=np.ndarray>
- coordinates :
- hFacW dt PHrefC Z iter dxC drF rAw dyG
- long_name :
- Zonal Component of Bolus Velocity
- mate :
- VVELSTAR
- standard_name :
- UVELSTAR
- units :
- m/s
Array Chunk Bytes 4.63 GiB 1.54 MiB Shape (288, 50, 240, 360) (1, 50, 90, 90) Count 28226 Tasks 3456 Chunks Type float32 numpy.ndarray - VVELSTAR(time, Z, lat_g, lon_c)float32dask.array<chunksize=(1, 50, 60, 90), meta=np.ndarray>
- coordinates :
- dt PHrefC Z iter dxG rAs hFacS dyC drF
- long_name :
- Meridional Component of Bolus Velocity
- mate :
- UVELSTAR
- standard_name :
- VVELSTAR
- units :
- m/s
Array Chunk Bytes 4.63 GiB 1.53 MiB Shape (288, 50, 240, 360) (1, 50, 89, 90) Count 54434 Tasks 5760 Chunks Type float32 numpy.ndarray - oceTAUX(time, lat_c, lon_g)float32dask.array<chunksize=(1, 60, 90), meta=np.ndarray>
- coordinates :
- dt iter dxC rAw dyG
- long_name :
- zonal surface wind stress, >0 increases uVel
- mate :
- oceTAUY
- standard_name :
- oceTAUX
- units :
- N/m^2
Array Chunk Bytes 94.92 MiB 31.64 kiB Shape (288, 240, 360) (1, 90, 90) Count 28226 Tasks 3456 Chunks Type float32 numpy.ndarray - oceTAUY(time, lat_g, lon_c)float32dask.array<chunksize=(1, 60, 90), meta=np.ndarray>
- coordinates :
- dt dxG iter rAs dyC
- long_name :
- meridional surf. wind stress, >0 increases vVel
- mate :
- oceTAUX
- standard_name :
- oceTAUY
- units :
- N/m^2
Array Chunk Bytes 94.92 MiB 31.29 kiB Shape (288, 240, 360) (1, 89, 90) Count 54434 Tasks 5760 Chunks Type float32 numpy.ndarray
fig, ax = plt.subplots()
pc = ds.basins.where(ds.basins > 0).plot(cmap='Set1')
pc.set_clim([0, 8])
atl_basins = [2, 7, 9, 10, 12, 19]
atl_mask = sum([ds.basins == basin_num for basin_num in atl_basins])
atl_mask.plot()
<matplotlib.collections.QuadMesh at 0x7f7ab5ab69d0>
grid = xgcm.Grid(ds, periodic=['X'])
grid
<xgcm.Grid>
T Axis (not periodic, boundary=None):
  * center   time --> inner
  * inner    time_snp --> center
Y Axis (not periodic, boundary=None):
  * center   lat_c --> left
  * left     lat_g --> center
X Axis (periodic, boundary=None):
  * center   lon_c --> left
  * left     lon_g --> center
Z Axis (not periodic, boundary=None):
  * center   Z --> left
  * left     Zl --> center
  * outer    Zp1 --> center
  * right    Zu --> center
mask_v = (grid.interp(atl_mask, 'Y', boundary='fill') > 0).compute()
volume_transport = (ds.VVELMASS * ds.drF * ds.dxG)
eddy_volume_transport = (ds.VVELSTAR * ds.drF * ds.dxG)

ds_transport = xr.merge([
    volume_transport.where(mask_v).sum('lon_c').rename('V_atl'),
    volume_transport.where(~mask_v).sum('lon_c').rename('V_rest'),
    eddy_volume_transport.where(mask_v).sum('lon_c').rename('V_eddy_atl'),
    eddy_volume_transport.where(~mask_v).sum('lon_c').rename('V_eddy_rest'),
]).reset_coords(drop=True)

ds_transport
<xarray.Dataset>
Dimensions:      (lat_g: 240, Z: 50, time: 288)
Coordinates:
  * time         (time) datetime64[ns] 1992-01-15 1992-02-13 ... 2015-12-14
  * Z            (Z) float32 -5.0 -15.0 -25.0 ... -5.461e+03 -5.906e+03
  * lat_g        (lat_g) float32 -81.61 -81.28 -80.95 ... 67.06 67.25 67.4
Data variables:
    V_atl        (time, Z, lat_g) float32 dask.array<chunksize=(1, 50, 60), meta=np.ndarray>
    V_rest       (time, Z, lat_g) float32 dask.array<chunksize=(1, 50, 60), meta=np.ndarray>
    V_eddy_atl   (time, Z, lat_g) float32 dask.array<chunksize=(1, 50, 60), meta=np.ndarray>
V_eddy_rest (time, Z, lat_g) float32 dask.array<chunksize=(1, 50, 60), meta=np.ndarray>- lat_g: 240
- Z: 50
- time: 288
- time(time)datetime64[ns]1992-01-15 ... 2015-12-14
- axis :
- T
- long_name :
- Time
- standard_name :
- time
array(['1992-01-15T00:00:00.000000000', '1992-02-13T00:00:00.000000000', '1992-03-15T00:00:00.000000000', ..., '2015-10-15T00:00:00.000000000', '2015-11-14T00:00:00.000000000', '2015-12-14T00:00:00.000000000'], dtype='datetime64[ns]') - Z(Z)float32-5.0 -15.0 ... -5.906e+03
- long_name :
- vertical coordinate of cell center
- positive :
- down
- standard_name :
- depth
- units :
- m
- axis :
- Z
array([-5.000000e+00, -1.500000e+01, -2.500000e+01, -3.500000e+01, -4.500000e+01, -5.500000e+01, -6.500000e+01, -7.500500e+01, -8.502500e+01, -9.509500e+01, -1.053100e+02, -1.158700e+02, -1.271500e+02, -1.397400e+02, -1.544700e+02, -1.724000e+02, -1.947350e+02, -2.227100e+02, -2.574700e+02, -2.999300e+02, -3.506800e+02, -4.099300e+02, -4.774700e+02, -5.527100e+02, -6.347350e+02, -7.224000e+02, -8.144700e+02, -9.097400e+02, -1.007155e+03, -1.105905e+03, -1.205535e+03, -1.306205e+03, -1.409150e+03, -1.517095e+03, -1.634175e+03, -1.765135e+03, -1.914150e+03, -2.084035e+03, -2.276225e+03, -2.491250e+03, -2.729250e+03, -2.990250e+03, -3.274250e+03, -3.581250e+03, -3.911250e+03, -4.264250e+03, -4.640250e+03, -5.039250e+03, -5.461250e+03, -5.906250e+03], dtype=float32) - lat_g(lat_g)float32-81.61 -81.28 -80.95 ... 67.25 67.4
- long_name :
- latitude
- standard_name :
- latitude_at_f_location
- units :
- degrees_north
- axis :
- Y
- c_grid_axis_shift :
- -0.5
array([-81.61184 , -81.283295, -80.95029 , ...,  67.06448 ,  67.24895 ,
        67.40169 ], dtype=float32)
- V_atl(time, Z, lat_g)float32dask.array<chunksize=(1, 50, 60), meta=np.ndarray>
Array Chunk Bytes 13.18 MiB 17.38 kiB Shape (288, 50, 240) (1, 50, 89) Count 83746 Tasks 1440 Chunks Type float32 numpy.ndarray - V_rest(time, Z, lat_g)float32dask.array<chunksize=(1, 50, 60), meta=np.ndarray>
Array Chunk Bytes 13.18 MiB 17.38 kiB Shape (288, 50, 240) (1, 50, 89) Count 83746 Tasks 1440 Chunks Type float32 numpy.ndarray - V_eddy_atl(time, Z, lat_g)float32dask.array<chunksize=(1, 50, 60), meta=np.ndarray>
Array Chunk Bytes 13.18 MiB 17.38 kiB Shape (288, 50, 240) (1, 50, 89) Count 90658 Tasks 1440 Chunks Type float32 numpy.ndarray - V_eddy_rest(time, Z, lat_g)float32dask.array<chunksize=(1, 50, 60), meta=np.ndarray>
Array Chunk Bytes 13.18 MiB 17.38 kiB Shape (288, 50, 240) (1, 50, 89) Count 90658 Tasks 1440 Chunks Type float32 numpy.ndarray
try:
    ds_transport = xr.open_dataset('tmp_data/ECCO_overturning_transport.nc')
except FileNotFoundError:
    import dask
    cluster.scale(10)
    with cluster.get_client():
        ds_transport.load()
        print('loaded')
    cluster.scale(0)
    ds_transport.to_netcdf('tmp_data/ECCO_overturning_transport.nc')
ds_transport
<xarray.Dataset>
Dimensions:      (time: 288, Z: 50, lat_g: 240)
Coordinates:
  * time         (time) datetime64[ns] 1992-01-15 1992-02-13 ... 2015-12-14
  * Z            (Z) float32 -5.0 -15.0 -25.0 ... -5.461e+03 -5.906e+03
  * lat_g        (lat_g) float32 -81.61 -81.28 -80.95 ... 67.06 67.25 67.4
Data variables:
    V_atl        (time, Z, lat_g) float32 ...
    V_rest       (time, Z, lat_g) float32 ...
    V_eddy_atl   (time, Z, lat_g) float32 ...
V_eddy_rest (time, Z, lat_g) float32 ...- time: 288
- Z: 50
- lat_g: 240
- time(time)datetime64[ns]1992-01-15 ... 2015-12-14
- axis :
- T
- long_name :
- Time
- standard_name :
- time
array(['1992-01-15T00:00:00.000000000', '1992-02-13T00:00:00.000000000', '1992-03-15T00:00:00.000000000', ..., '2015-10-15T00:00:00.000000000', '2015-11-14T00:00:00.000000000', '2015-12-14T00:00:00.000000000'], dtype='datetime64[ns]') - Z(Z)float32-5.0 -15.0 ... -5.906e+03
- long_name :
- vertical coordinate of cell center
- positive :
- down
- standard_name :
- depth
- units :
- m
- axis :
- Z
array([-5.000000e+00, -1.500000e+01, -2.500000e+01, -3.500000e+01, -4.500000e+01, -5.500000e+01, -6.500000e+01, -7.500500e+01, -8.502500e+01, -9.509500e+01, -1.053100e+02, -1.158700e+02, -1.271500e+02, -1.397400e+02, -1.544700e+02, -1.724000e+02, -1.947350e+02, -2.227100e+02, -2.574700e+02, -2.999300e+02, -3.506800e+02, -4.099300e+02, -4.774700e+02, -5.527100e+02, -6.347350e+02, -7.224000e+02, -8.144700e+02, -9.097400e+02, -1.007155e+03, -1.105905e+03, -1.205535e+03, -1.306205e+03, -1.409150e+03, -1.517095e+03, -1.634175e+03, -1.765135e+03, -1.914150e+03, -2.084035e+03, -2.276225e+03, -2.491250e+03, -2.729250e+03, -2.990250e+03, -3.274250e+03, -3.581250e+03, -3.911250e+03, -4.264250e+03, -4.640250e+03, -5.039250e+03, -5.461250e+03, -5.906250e+03], dtype=float32) - lat_g(lat_g)float32-81.61 -81.28 -80.95 ... 67.25 67.4
- long_name :
- latitude
- standard_name :
- latitude_at_f_location
- units :
- degrees_north
- axis :
- Y
- c_grid_axis_shift :
- -0.5
array([-81.61184 , -81.283295, -80.95029 , ...,  67.06448 ,  67.24895 ,
        67.40169 ], dtype=float32)
- V_atl(time, Z, lat_g)float32...
[3456000 values with dtype=float32]
- V_rest(time, Z, lat_g)float32...
[3456000 values with dtype=float32]
- V_eddy_atl(time, Z, lat_g)float32...
[3456000 values with dtype=float32]
- V_eddy_rest(time, Z, lat_g)float32...
[3456000 values with dtype=float32]
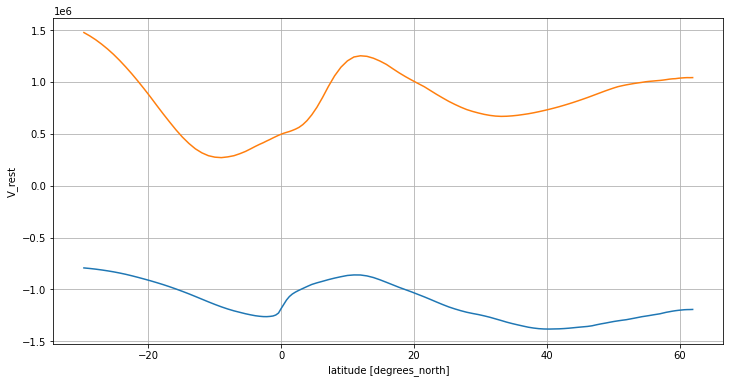
ds_transport.V_atl.mean('time').sum('Z').sel(lat_g=slice(-30, 62)).plot()
ds_transport.V_rest.mean('time').sum('Z').sel(lat_g=slice(-30, 62)).plot()
plt.grid()
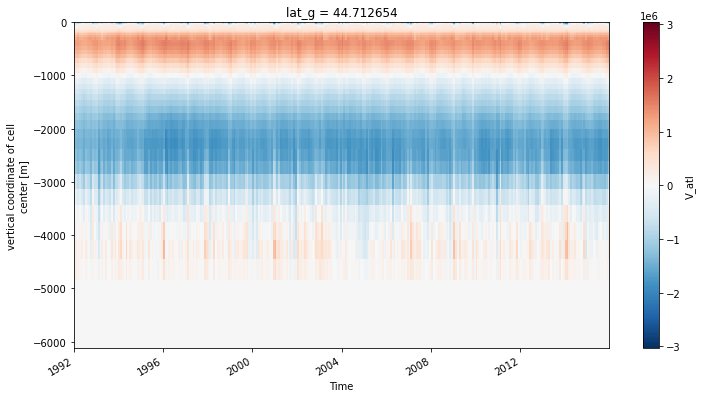
ds_transport.V_atl.sel(lat_g=45, method='nearest').plot(x='time')
<matplotlib.collections.QuadMesh at 0x7f7e3424ed90>
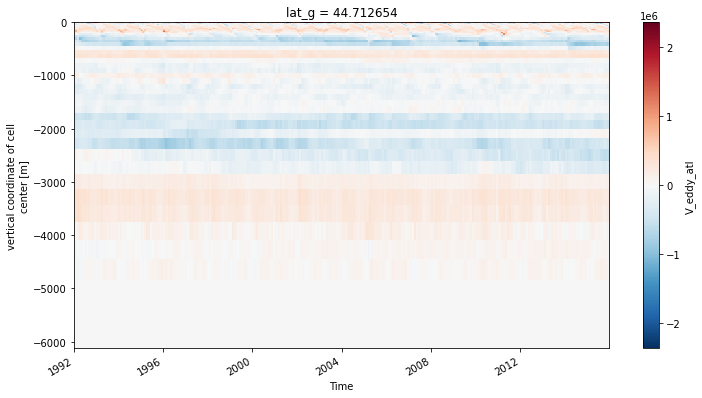
ds_transport.V_eddy_atl.sel(lat_g=45, method='nearest').plot(x='time')
<matplotlib.collections.QuadMesh at 0x7f7e34195e20>
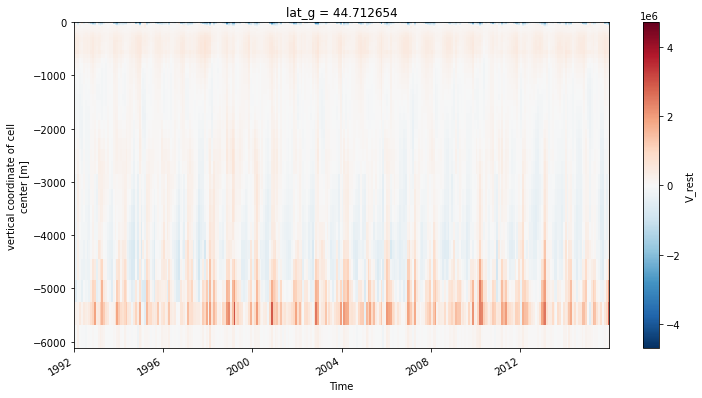
ds_transport.V_rest.sel(lat_g=45, method='nearest').plot(x='time')
<matplotlib.collections.QuadMesh at 0x7f7e340cbdf0>
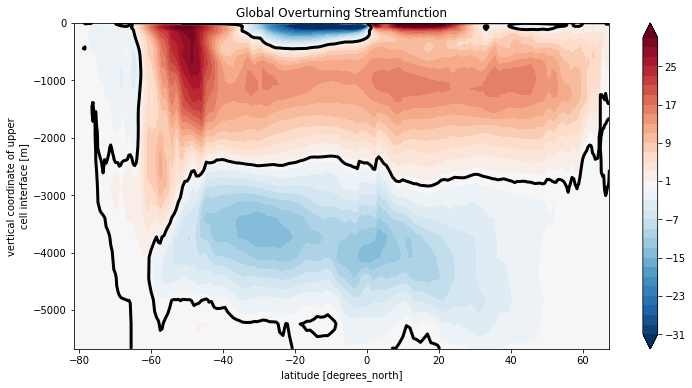
def make_mean_streamfunction(V):
    return grid.cumsum(V, 'Z', boundary='fill').mean('time') / 1e6
streamfunctions = ds_transport.map(make_mean_streamfunction)
Psi_tot = sum(streamfunctions[v] for v in streamfunctions.data_vars)
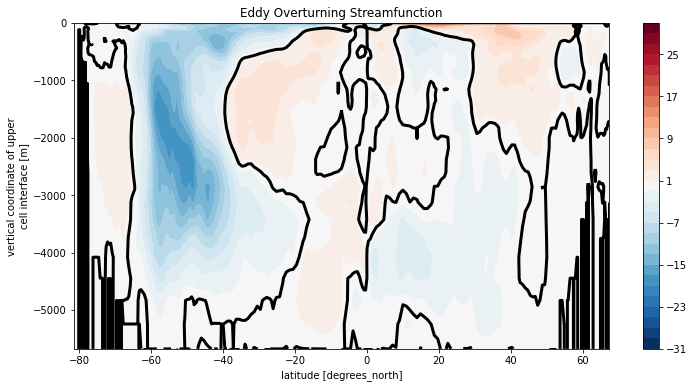
Psi_eddy = (streamfunctions['V_eddy_atl'] + streamfunctions['V_eddy_rest'])
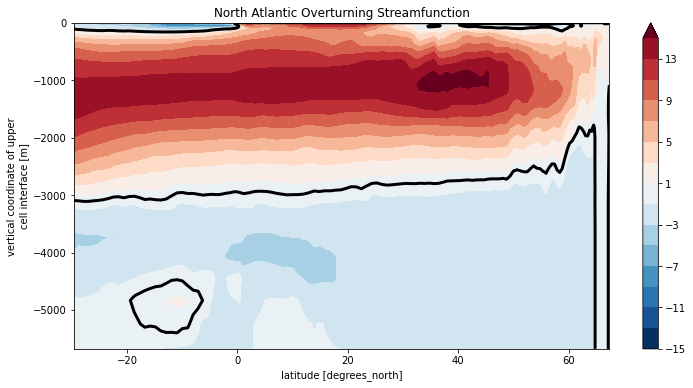
Psi_atl = (streamfunctions['V_atl'] + streamfunctions['V_eddy_atl']).sel(lat_g=slice(-30, None))
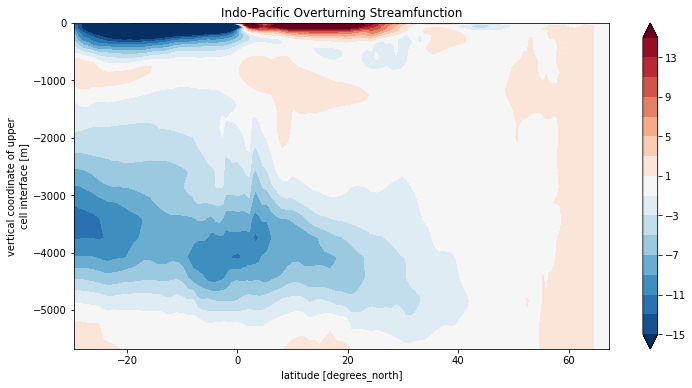
Psi_rest = (streamfunctions['V_rest'] + streamfunctions['V_eddy_rest']).sel(lat_g=slice(-30, None))
Psi_SO = Psi_tot.sel(lat_g=slice(None, -30))
clevels = np.arange(-32, 32, 2) + 1
Psi_tot.plot.contourf(levels=clevels, yincrease=True)
Psi_tot.plot.contour(levels=[0], colors='k', linewidths=3)
plt.title('Global Overturning Streamfunction')
Text(0.5, 1.0, 'Global Overturning Streamfunction')
clevels = np.arange(-32, 32, 2) + 1
Psi_eddy.plot.contourf(levels=clevels, yincrease=True)
Psi_eddy.plot.contour(levels=[0], colors='k', linewidths=3)
plt.title('Eddy Overturning Streamfunction')
Text(0.5, 1.0, 'Eddy Overturning Streamfunction')
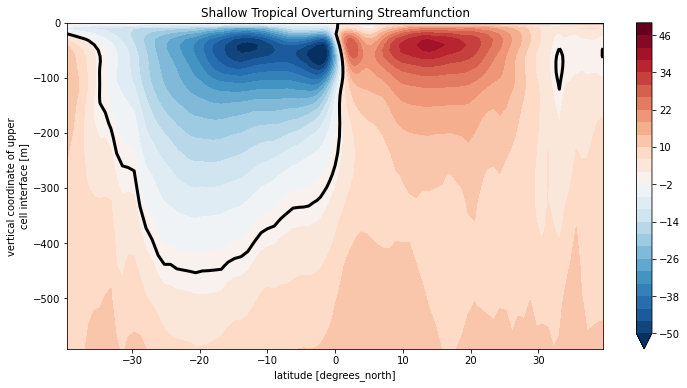
Psi_upper = Psi_tot.sel(lat_g=slice(-40, 40), Zl=slice(0, -600))
Psi_upper.plot.contourf(levels=np.arange(-50,52,4), yincrease=True)
Psi_upper.plot.contour(levels=[0], colors='k', linewidths=3)
plt.title('Shallow Tropical Overturning Streamfunction');
Psi_atl.plot.contourf(levels=np.arange(-15, 16, 2), yincrease=True)
Psi_atl.plot.contour(levels=[0], colors='k', linewidths=3)

plt.title('North Atlantic Overturning Streamfunction')
Text(0.5, 1.0, 'North Atlantic Overturning Streamfunction')
Psi_rest.plot.contourf(levels=np.arange(-15, 16, 2), yincrease=True)
plt.title('Indo-Pacific Overturning Streamfunction')
Text(0.5, 1.0, 'Indo-Pacific Overturning Streamfunction')
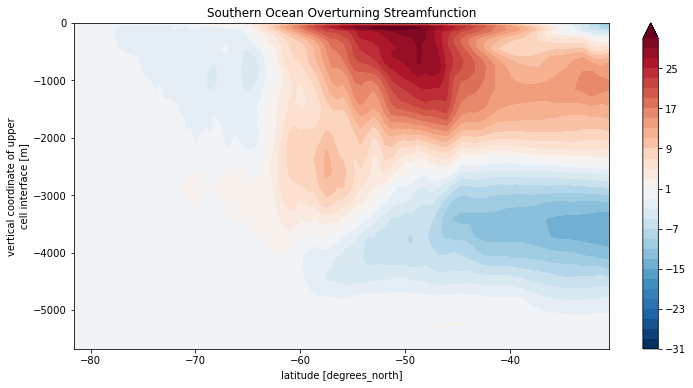
Psi_SO.plot.contourf(levels=clevels, yincrease=True)
plt.title('Southern Ocean Overturning Streamfunction')
Text(0.5, 1.0, 'Southern Ocean Overturning Streamfunction')